Here are the essential concepts you must grasp in order to answer the question correctly.
Ideal Gas Behavior
Ideal gas behavior refers to the theoretical condition where a gas perfectly follows the ideal gas law (PV=nRT) without deviations. This occurs at high temperatures and low pressures, where intermolecular forces are negligible, and the volume of gas particles is insignificant compared to the volume of the container. Understanding this concept is crucial for identifying conditions under which real gases, like SO2, behave more like ideal gases.
Recommended video:
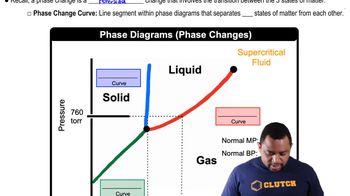
Phase Diagram
A phase diagram is a graphical representation that shows the phases of a substance (solid, liquid, gas) at various temperatures and pressures. It helps visualize the conditions under which a substance exists in different states and the transitions between these states. In the context of the question, the phase diagram for SO2 indicates the regions where the gas phase is stable and where it may exhibit ideal behavior.
Recommended video:
Phase Changes in Diagrams
Critical Point
The critical point on a phase diagram marks the end of the liquid-gas phase boundary, beyond which the distinction between liquid and gas phases disappears. At this point, the substance exhibits unique properties, and the behavior of gases can deviate significantly from ideal conditions. Recognizing the critical point is essential for understanding where SO2 may approach ideal gas behavior, particularly in relation to the marked points in the diagram.
Recommended video:


 01:15
01:15