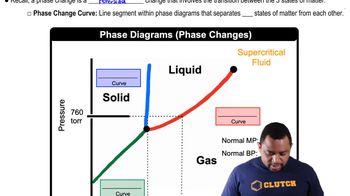
Nitrogen has a normal boiling point of 77.3 K and a melting point (at 1 atm) of 63.1 K. Its critical temperature is 126.2 K and its critical pressure is 2.55×10⁴ torr. It has a triple point at 63.1 K and 94.0 torr. Sketch the phase diagram for nitrogen. Does nitrogen have a stable liquid state at 1 atm?
Ch.11 - Liquids, Solids & Intermolecular Forces
Chapter 11, Problem 74
Consider the phase diagram for iodine shown here. a. What is the normal boiling point for iodine? b. What is the melting point for iodine at 1 atm? c. What state is present at room temperature and normal atmospheric pressure? d. What state is present at 186 °C and 1.0 atm?
Verified step by step guidance1
Step 1: Understand the phase diagram. A phase diagram shows the state of a substance at various temperatures and pressures. Identify the axes: typically, pressure is on the y-axis and temperature on the x-axis.
Step 2: Locate the normal boiling point. The normal boiling point is the temperature at which the substance transitions from liquid to gas at 1 atm pressure. Find the point on the diagram where the liquid-gas boundary intersects 1 atm.
Step 3: Determine the melting point at 1 atm. The melting point is where the substance transitions from solid to liquid at 1 atm. Locate the point on the diagram where the solid-liquid boundary intersects 1 atm.
Step 4: Identify the state at room temperature and normal atmospheric pressure. Room temperature is approximately 25 °C, and normal atmospheric pressure is 1 atm. Find this point on the diagram and determine which region (solid, liquid, or gas) it falls into.
Step 5: Determine the state at 186 °C and 1.0 atm. Locate this point on the phase diagram and identify which region it falls into to determine the state of iodine at these conditions.
Key Concepts
Here are the essential concepts you must grasp in order to answer the question correctly.
Phase Diagrams
A phase diagram is a graphical representation that shows the states of a substance (solid, liquid, gas) at various temperatures and pressures. It typically includes lines that separate different phases, indicating conditions under which a substance will change from one phase to another. Understanding phase diagrams is crucial for determining boiling and melting points, as well as predicting the state of a substance under specific conditions.
Recommended video:
Guided course
Phase Changes in Diagrams
Normal Boiling Point
The normal boiling point of a substance is the temperature at which it transitions from a liquid to a gas at a pressure of 1 atmosphere (atm). This point is significant because it reflects the energy required for the molecules to overcome intermolecular forces and enter the gaseous state. For iodine, identifying the normal boiling point involves locating the corresponding temperature on the phase diagram at 1 atm.
Recommended video:
Guided course
Boiling Point Elevation
Melting Point
The melting point is the temperature at which a solid becomes a liquid at a given pressure, typically 1 atm. This point is where the solid and liquid phases coexist in equilibrium. In the context of iodine, the melting point can be determined from the phase diagram by finding the temperature at which the solid phase transitions to the liquid phase at 1 atm pressure.
Recommended video:
Guided course
Boiling Point and Melting Point
Related Practice
Textbook Question
2550
views
Textbook Question
Consider the phase diagram shown here. Identify the states present at points a through g.
1221
views
Textbook Question
Argon has a normal boiling point of 87.2 K and a melting point (at 1 atm) of 84.1 K. Its critical temperature is 150.8 K and its critical pressure is 48.3 atm. It has a triple point at 83.7 K and 0.68 atm. Sketch the phase diagram for argon. Which has the greater density, solid argon or liquid argon?
2352
views
Textbook Question
The phase diagram for sulfur is shown here. The rhombic and monoclinic states are two solid states with different structures. a. Below what pressure does solid sulfur sublime?
1586
views
