18. Aqueous Equilibrium
Weak Titrate-Strong Titrant Curves
Problem 41a
Textbook Question
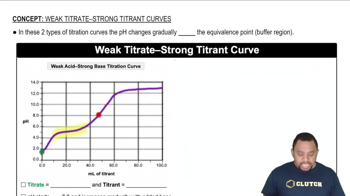
Textbook QuestionThe following plot shows two pH titration curves, each representing the titration of 50.0 mL of 0.100 M acid with 0.100 M NaOH:

 Verified Solution
This video solution was recommended by our tutors as helpful for the problem above
Video duration:
4m796
views
Was this helpful?
Related Videos
Related Practice

 02:43
02:43


Showing 1 of 5 videos