Here are the essential concepts you must grasp in order to answer the question correctly.
Continuity of Functions
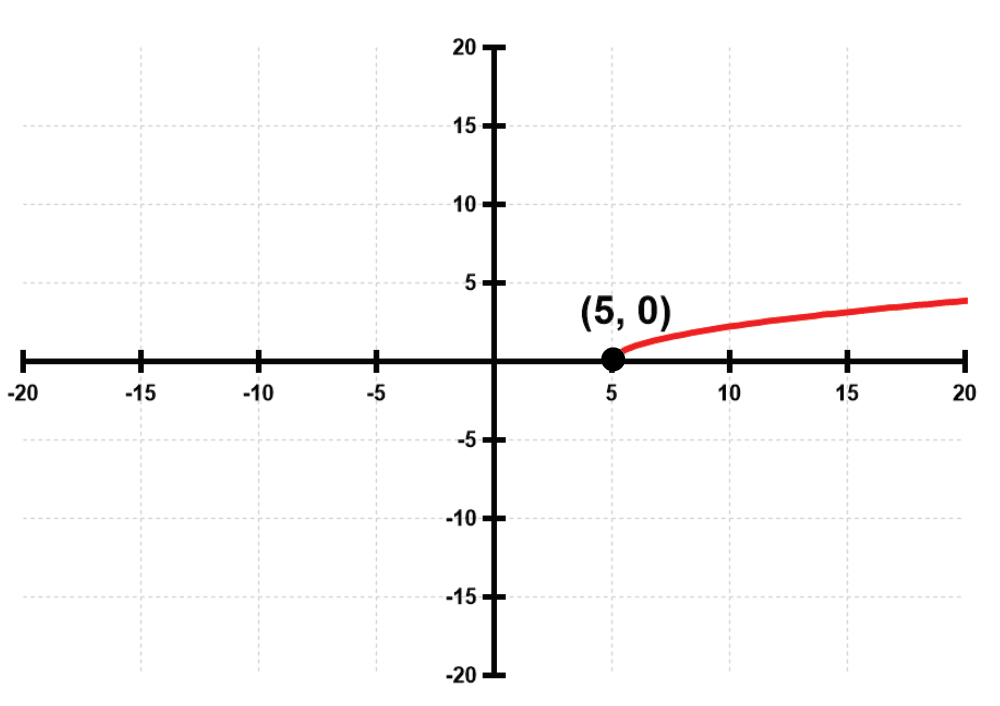
A function is continuous at a point if the limit of the function as it approaches that point equals the function's value at that point. For a function to be continuous over an interval, it must be continuous at every point within that interval, meaning there are no breaks, jumps, or holes in the graph.
Recommended video:
Graphs of Common Functions
Intervals of Continuity
Intervals of continuity refer to the ranges of the independent variable (usually x) where a function remains continuous. These intervals can be expressed in interval notation, indicating where the function does not have any discontinuities, such as vertical asymptotes or removable discontinuities.
Recommended video:
Identifying Discontinuities
Discontinuities can occur in various forms, including removable (holes), jump, and infinite discontinuities. To determine where a function is continuous, one must identify these points by analyzing the function's behavior, particularly at critical points like where the function is undefined or where it changes direction.
Recommended video:
Determining Removable Discontinuities (Holes)


