Here are the essential concepts you must grasp in order to answer the question correctly.
Graphing Functions
Graphing functions involves plotting points on a coordinate plane to visualize the relationship between the independent variable (x) and the dependent variable (y). For the equation y = x^3 - 1, you will calculate y for each given x value, creating a set of points that can be connected to form the graph. Understanding how to interpret and create graphs is essential for analyzing the behavior of functions.
Recommended video:
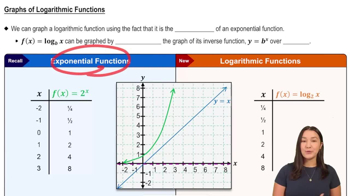
Graphs of Logarithmic Functions
Cubic Functions
A cubic function is a polynomial function of degree three, typically expressed in the form y = ax^3 + bx^2 + cx + d. The function y = x^3 - 1 is a specific cubic function where the leading coefficient is 1 and the constant term is -1. Cubic functions exhibit unique characteristics, such as having one or two turning points and can model various real-world scenarios.
Recommended video:
Evaluating Functions
Evaluating functions involves substituting specific values of the independent variable into the function to find the corresponding output. In this case, you will substitute x values of -3, -2, -1, 0, 1, 2, and 3 into the equation y = x^3 - 1 to determine the corresponding y values. This process is fundamental for graphing and understanding the function's behavior.
Recommended video:
Evaluating Composed Functions
 Verified step by step guidance


