Here are the essential concepts you must grasp in order to answer the question correctly.
Quadratic Functions
A quadratic function is a polynomial function of degree two, typically expressed in the form y = ax^2 + bx + c. The graph of a quadratic function is a parabola, which can open upwards or downwards depending on the sign of the coefficient 'a'. Understanding the shape and properties of parabolas is essential for graphing quadratic equations.
Recommended video:
Solving Quadratic Equations Using The Quadratic Formula
Evaluating Functions
Evaluating a function involves substituting specific values for the variable(s) in the function's equation. In this case, substituting the given x-values (-3, -2, -1, 0, 1, 2, 3) into the equation y = x^2 - 3 allows us to calculate the corresponding y-values. This process is crucial for plotting points on the graph.
Recommended video:
Evaluating Composed Functions
Graphing Points
Graphing points involves plotting the calculated (x, y) pairs on a coordinate plane. Each point represents a solution to the equation, and connecting these points helps visualize the function's behavior. Understanding how to accurately plot points and interpret the resulting graph is vital for analyzing the function's characteristics.
Recommended video:
Graphing Equations of Two Variables by Plotting Points

 This video solution was recommended by our tutors as helpful for the problem above.
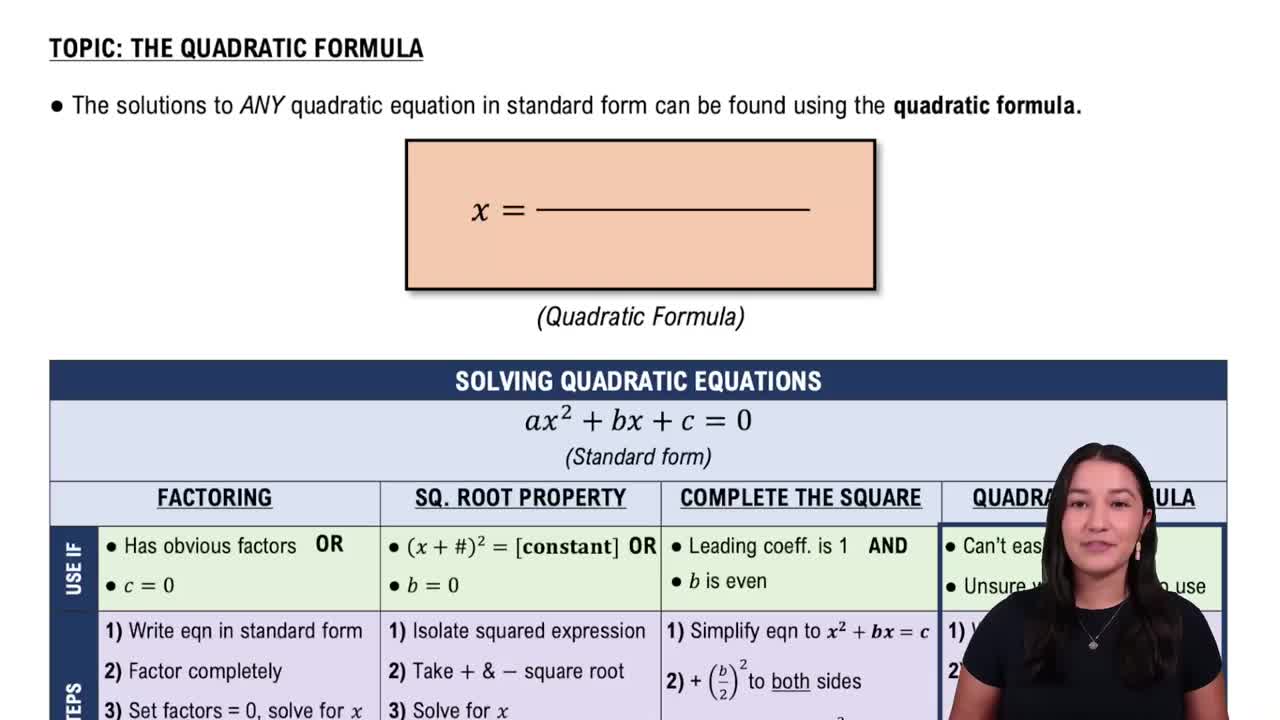
 06:36
06:36
