4. Polynomial Functions
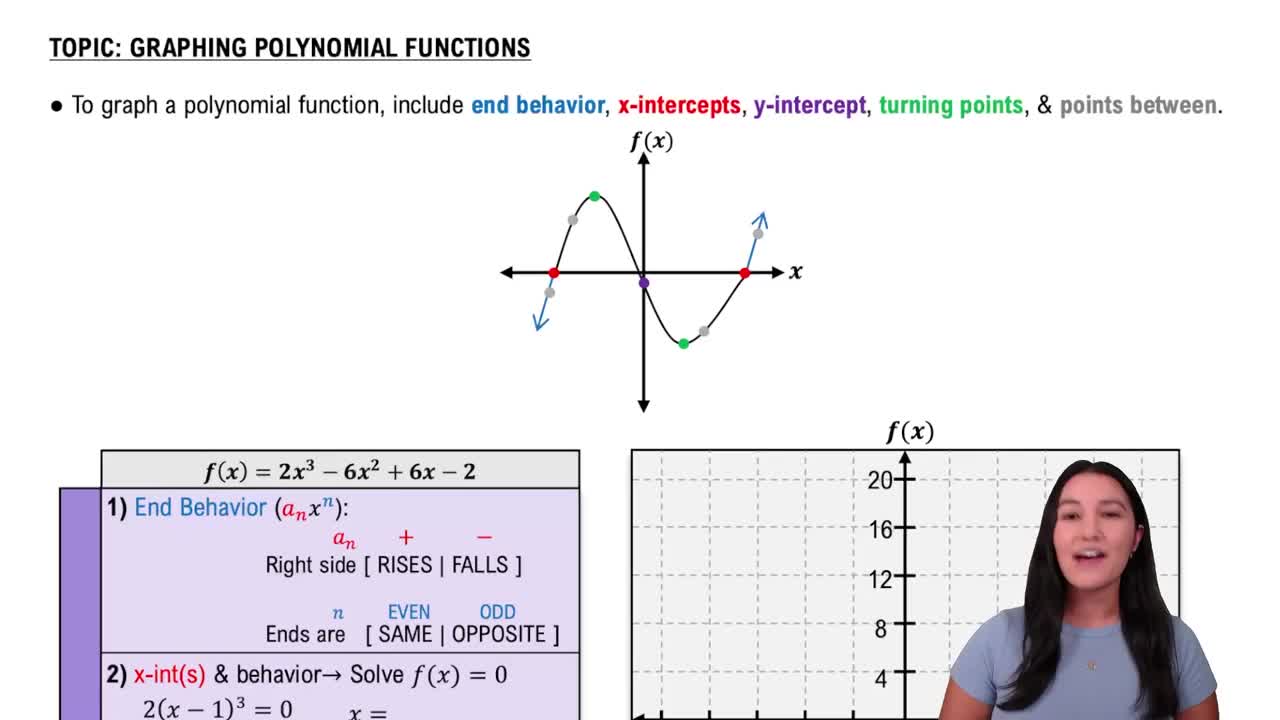
Graphing Polynomial Functions

 05:01
05:01
Learn with other creators


Practice this topic
- Multiple Choice
Based on the known points plotted on the graph, determine what intervals the graph should be broken into.
Plotted points are: &
641views3rank - Multiple Choice
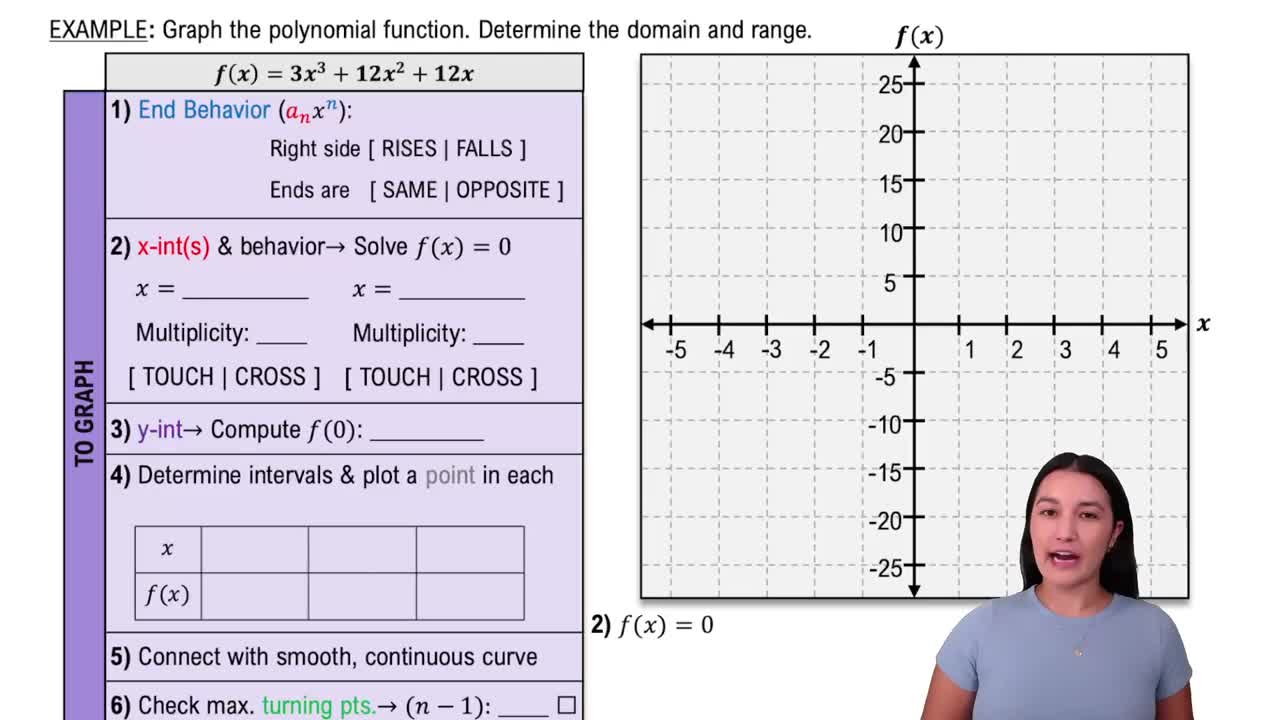
Graph the polynomial function. Determine the domain and range.
931views3rank2comments - Textbook Question
Use the Leading Coefficient Test to determine the end behavior of the graph of the polynomial function.
467views - Textbook Question
Use the Leading Coefficient Test to determine the end behavior of the graph of the polynomial function.
470views - Textbook Question
In Exercises 19–24, use the Leading Coefficient Test to determine the end behavior of the graph of the polynomial function.
605views - Textbook Question
In Exercises 15–18, use the Leading Coefficient Test to determine the end behavior of the graph of the given polynomial function. Then use this end behavior to match the polynomial function with its graph. [The graphs are labeled (a) through (d).] <IMAGE>
523views