Here are the essential concepts you must grasp in order to answer the question correctly.
Piecewise Functions
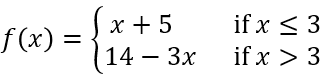
A piecewise function is defined by different expressions based on the input value. Each segment of the function applies to a specific interval of the domain, allowing for varied behavior in different regions. Understanding how to interpret and graph these functions is crucial, as it involves determining which expression to use based on the value of x.
Recommended video:
Graphing Techniques
Graphing piecewise functions requires plotting each segment separately according to its defined conditions. This involves identifying the endpoints of each interval and determining whether they are included (closed dot) or excluded (open dot) in the graph. Mastery of these techniques is essential for accurately representing the function visually.
Recommended video:
Graphs and Coordinates - Example
Continuity and Discontinuity
Continuity refers to whether a function has any breaks, jumps, or holes in its graph. For piecewise functions, it is important to check the transition points where the definition changes, as these points can indicate discontinuities. Understanding continuity helps in analyzing the overall behavior of the function and ensuring accurate graphing.
Recommended video:
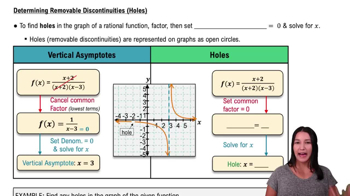
Determining Removable Discontinuities (Holes)
 Verified step by step guidance
 4:56
4:56