Ch. 2 - Graphs and Functions
Lial - College Algebra 13th Edition
Lial13th EditionCollege AlgebraISBN: 9780136881063Not the one you use?Change textbook
Chapter 3, Problem 15

Determine the intervals of the domain over which each function is continuous.
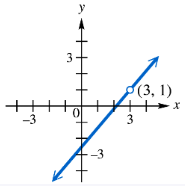
Graph of a linear function with an open circle at point (3,1) showing continuity intervals on the x-axis.

Verified step by step guidance
1
Step 1: Identify the function and its graph. The graph shows a linear function represented by a red line, but there is an open circle at the point (1, 13), indicating the function is not defined at x = 1 with the value 13.
Step 2: Recall the definition of continuity for a function at a point x = a. A function f is continuous at x = a if the following three conditions are met: (1) f(a) is defined, (2) the limit of f(x) as x approaches a exists, and (3) the limit of f(x) as x approaches a equals f(a).
Step 3: Analyze the continuity at x = 1. The graph shows an open circle at (1, 13), so f(1) is not equal to 13 (likely undefined or defined differently). The red line approaches a certain value as x approaches 1, but since the function value at 1 is not on the line, the function is not continuous at x = 1.
Step 4: Determine the intervals where the function is continuous. Since the function is a linear function everywhere else, it is continuous on the intervals (-∞, 1) and (1, ∞), excluding the point x = 1 where the discontinuity occurs.
Step 5: Summarize the domain intervals of continuity. The function is continuous on the intervals \((-\infty, 1)\) and \((1, \infty)\), but not continuous at \(x = 1\) due to the open circle indicating a discontinuity.

Verified video answer for a similar problem:

This video solution was recommended by our tutors as helpful for the problem above.
Video duration:
2m
Was this helpful?

Key Concepts

Here are the essential concepts you must grasp in order to answer the question correctly.

Continuity of a Function

A function is continuous at a point if the limit of the function as it approaches the point equals the function's value at that point. This means there are no breaks, jumps, or holes in the graph at that point. Continuity over an interval means the function is continuous at every point within that interval.
Recommended video:
5:57
Graphs of Common Functions

Domain of a Function

The domain of a function is the set of all possible input values (x-values) for which the function is defined. Understanding the domain is essential to determine where the function can be evaluated and to analyze continuity within those intervals.
Recommended video:
3:51
Domain Restrictions of Composed Functions

Graphical Interpretation of Continuity

A graph helps visualize continuity by showing if the function has any breaks, holes, or jumps. An open circle on the graph indicates a point where the function is not defined or does not equal the limit, signaling discontinuity at that point. Continuous intervals are where the graph is unbroken and connected.
Recommended video:
2:57
Probability of Non-Mutually Exclusive Events Example