Ch. 2 - Graphs and Functions
Lial - College Algebra 13th Edition
Lial13th EditionCollege AlgebraISBN: 9780136881063Not the one you use?Change textbook
Chapter 3, Problem 14

Determine the intervals of the domain over which each function is continuous.
Graph of a function showing a curve starting at point (0, -1) and extending leftward and downward on the xy-plane.

Verified step by step guidance
1
Step 1: Identify the domain of the function from the graph. The function is drawn from the left side extending towards x = 5, where there is a solid point at (5, 0). This indicates the function is defined up to and including x = 5.
Step 2: Understand the meaning of continuity on an interval. A function is continuous on an interval if there are no breaks, jumps, or holes in the graph over that interval.
Step 3: Observe the graph from the left side up to x = 5. The curve is smooth and connected without any breaks, so the function is continuous on the interval from negative infinity to 5.
Step 4: Check the point at x = 5. Since there is a solid point at (5, 0), the function is defined and continuous at x = 5 as well.
Step 5: Conclude that the function is continuous on the interval \((-\infty, 5]\) because the graph is continuous up to and including x = 5, and there are no other parts of the function shown beyond x = 5.

Verified video answer for a similar problem:

This video solution was recommended by our tutors as helpful for the problem above.
Video duration:
1m
Was this helpful?

Key Concepts

Here are the essential concepts you must grasp in order to answer the question correctly.

Continuity of a Function

A function is continuous at a point if the limit of the function as it approaches the point equals the function's value at that point. This means there are no breaks, jumps, or holes in the graph at that point. Continuity over an interval means the function is continuous at every point within that interval.
Recommended video:
5:57
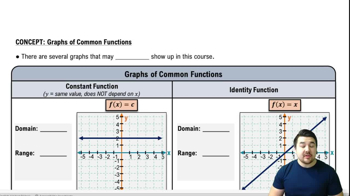
Graphs of Common Functions

Intervals of Continuity

Intervals of continuity are ranges of the domain where the function remains continuous without interruption. These intervals can be open, closed, or half-open depending on whether the endpoints are included. Identifying these intervals involves checking for points where the function might be undefined or discontinuous.
Recommended video:
05:18
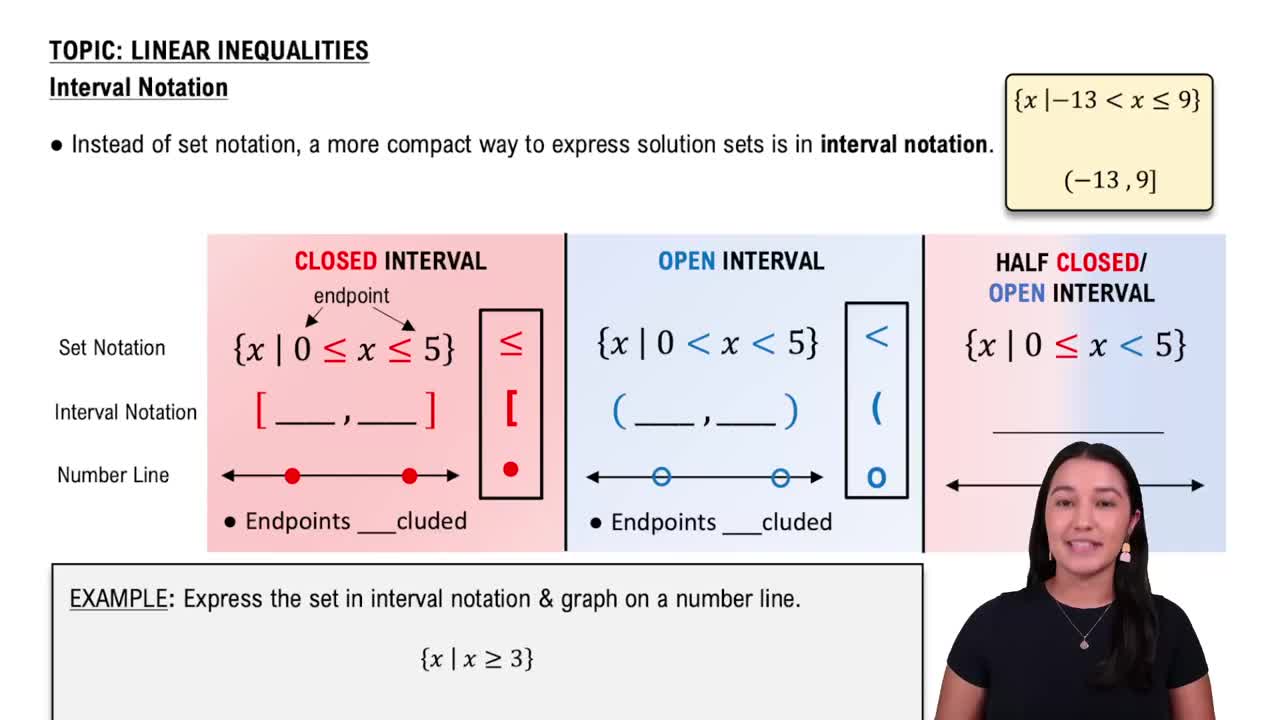
Interval Notation

Graphical Interpretation of Continuity

The graph of a function helps visualize continuity by showing if the curve can be drawn without lifting the pen. Points marked on the graph, such as (5, 0) in this case, indicate specific values to check for continuity. A filled dot means the function is defined at that point, which is crucial for determining continuity.
Recommended video:
2:57
Probability of Non-Mutually Exclusive Events Example