Solve each problem. During the course of a year, the number of volunteers available to run a food bank each month is modeled by , where between the months of January and August. Here x is time in months, with x=1 representing January. From August to December, is modeled by . Find the number of volunteers in each of the following months. Sketch a graph of for January through December. In what month are the fewest volunteers available?

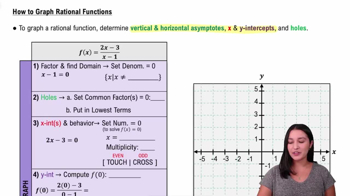
Use the graph to solve each equation or inequality. Use interval notation where appropriate. 2(x-2) / {(x-1)(x-3)} < 0

Verified step by step guidance
Verified video answer for a similar problem:
Key Concepts
Rational Inequalities
Critical Points and Sign Analysis
Graph Interpretation of Rational Functions
Determine whether each statement is true or false. If false, explain why. The product of a complex number and its conjugate is always a real number.
Solve each problem. During the course of a year, the number of volunteers available to run a food bank each month is modeled by , where between the months of January and August. Here x is time in months, with x=1 representing January. From August to December, is modeled by . Find the number of volunteers in each of the following months.
October
Provide a short answer to each question. Is ƒ(x)=1/x an even or an odd function? What symmetry does its graph exhibit?
Graph each function. Determine the largest open intervals of the domain over which each function is (a) increasing or (b) decreasing. ƒ(x)=2x4
Solve each problem. During the course of a year, the number of volunteers available to run a food bank each month is modeled by , where between the months of January and August. Here x is time in months, with x=1 representing January. From August to December, is modeled by . Find the number of volunteers in each of the following months.
December
