Here are the essential concepts you must grasp in order to answer the question correctly.
Quadratic Functions
A quadratic function is a polynomial function of degree two, typically expressed in the form V(x) = ax^2 + bx + c. In this case, V(x) = 2x^2 - 32x + 150 represents the number of volunteers from January to August. Understanding the properties of quadratic functions, such as their vertex, axis of symmetry, and direction of opening, is essential for analyzing the behavior of the volunteer numbers over these months.
Recommended video:
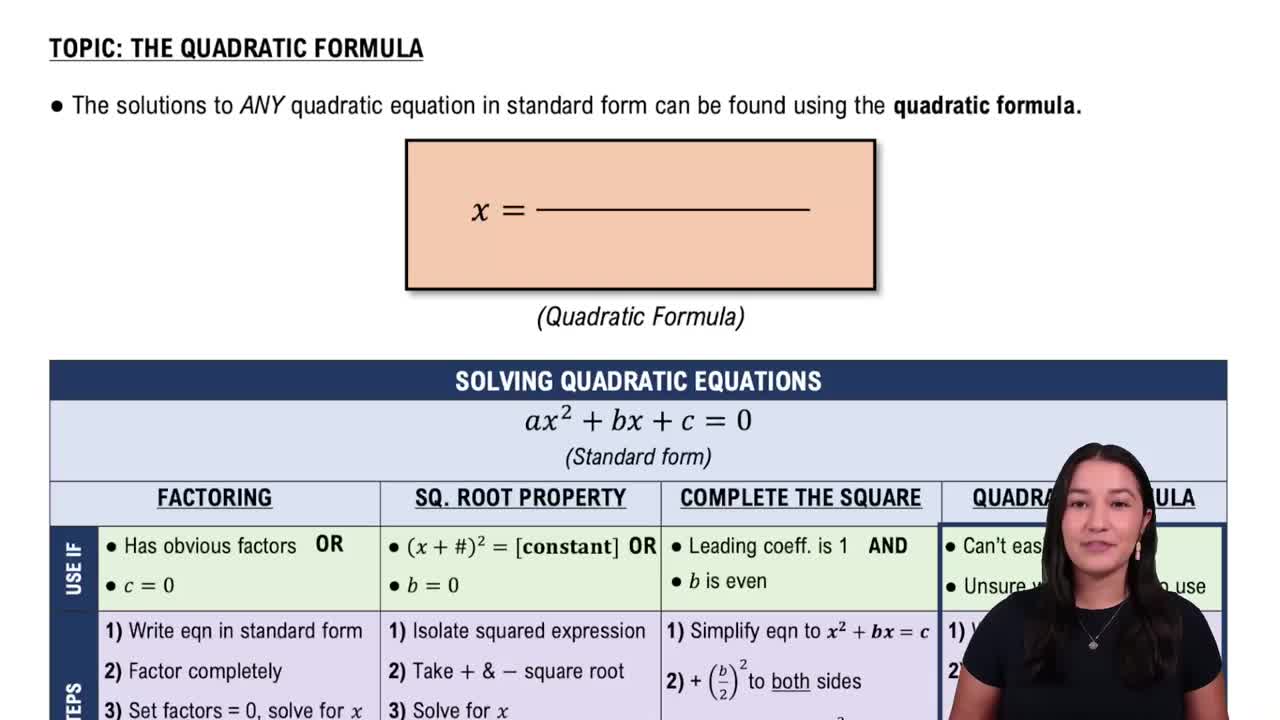
Solving Quadratic Equations Using The Quadratic Formula
Piecewise Functions
A piecewise function is defined by different expressions based on the input value. In this scenario, V(x) is modeled by two different equations: a quadratic function for January to August and a linear function for August to December. Recognizing how to evaluate and graph piecewise functions is crucial for determining the number of volunteers in each month and understanding the transition between the two models.
Recommended video:
Graphing Functions
Graphing functions involves plotting points on a coordinate plane to visualize the relationship between variables. For V(x), sketching the graph from January to December requires plotting the quadratic function for the first eight months and the linear function for the last four. This visual representation helps identify trends, such as the month with the fewest volunteers, by observing the lowest point on the graph.
Recommended video:
Graphs of Logarithmic Functions


 06:36
06:36
