5. Graphical Applications of Derivatives
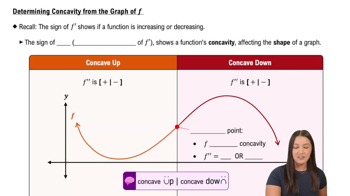
Concavity
Problem 4.R.2f
Textbook Question
Locating extrema Consider the graph of a function ƒ on the interval [-3, 3]. <IMAGE>
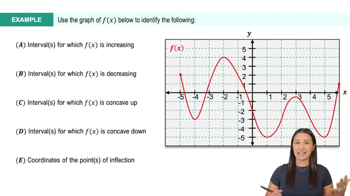
f. On what intervals (approximately) is f concave down?
 Verified step by step guidance
1
To determine where the function f is concave down, we need to analyze the second derivative, f''(x). A function is concave down on intervals where its second derivative is negative.
Since we don't have the explicit function or its derivatives, we will rely on the graph's visual cues. Look for sections of the graph where the curve is bending downwards, resembling an upside-down bowl.
Identify the points on the graph where the concavity changes. These are typically where the graph changes from bending upwards to downwards or vice versa, known as inflection points.
Estimate the intervals between these inflection points where the graph appears to be concave down. These are the intervals where the slope of the tangent line is decreasing.
Once you have identified these intervals, you can state them approximately based on the x-values of the inflection points observed on the graph.
Verified video answer for a similar problem:This video solution was recommended by our tutors as helpful for the problem above
Video duration:
2mWas this helpful?
Key Concepts
Here are the essential concepts you must grasp in order to answer the question correctly.
Concavity
Concavity refers to the direction in which a function curves. A function is concave up if its graph opens upwards, resembling a cup, and concave down if it opens downwards, like an upside-down cup. This behavior is determined by the second derivative of the function; if the second derivative is negative over an interval, the function is concave down on that interval.
Recommended video:

 05:59
05:59Determining Concavity Given a Function
Second Derivative Test
The second derivative test is a method used to determine the concavity of a function and locate its extrema. If the second derivative of a function is positive at a point, the function is concave up at that point, indicating a local minimum. Conversely, if the second derivative is negative, the function is concave down, suggesting a local maximum.
Recommended video:
 06:02
06:02The Second Derivative Test: Finding Local Extrema
Intervals of Concavity
Intervals of concavity are specific ranges on the x-axis where a function exhibits consistent concavity. To find these intervals, one must analyze the sign of the second derivative across the domain of the function. By identifying where the second derivative changes sign, one can determine the intervals where the function is concave up or concave down.
Recommended video:
05:59Determining Concavity Given a Function
 6:38m
6:38mWatch next
Master Determining Concavity from the Graph of f with a bite sized video explanation from Callie
Start learningRelated Videos
Related Practice