0. Functions
Inverse Trigonometric Functions
Problem 3.10.62a
Textbook Question
62–65. {Use of Tech} Graphing f and f'
a. Graph f with a graphing utility.
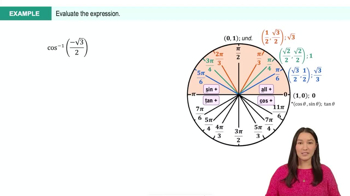
f(x) = (x−1) sin^−1 x on [−1,1]
 Verified step by step guidance
1
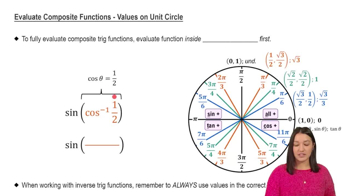
Step 1: Understand the function f(x) = (x - 1) sin^−1(x). This function is composed of two parts: a linear term (x - 1) and the inverse sine function sin^−1(x). The domain of sin^−1(x) is [-1, 1], which matches the interval given for graphing.
Step 2: Use a graphing utility to plot the function f(x) over the interval [-1, 1]. Ensure that the graphing tool can handle inverse trigonometric functions and is set to the correct interval.
Step 3: Analyze the graph of f(x). Look for key features such as intercepts, maxima, minima, and points of inflection. Note how the linear term (x - 1) affects the shape of the graph in combination with sin^−1(x).
Step 4: To graph f'(x), first find the derivative of f(x). Use the product rule for differentiation, which states that if you have a function h(x) = u(x)v(x), then h'(x) = u'(x)v(x) + u(x)v'(x). Apply this to f(x) = (x - 1) sin^−1(x).
Step 5: After finding f'(x), use the graphing utility to plot the derivative over the same interval [-1, 1]. Compare the graphs of f(x) and f'(x) to understand how the derivative reflects the rate of change and behavior of the original function.
Verified video answer for a similar problem:This video solution was recommended by our tutors as helpful for the problem above
Video duration:
4mWas this helpful?
Key Concepts
Here are the essential concepts you must grasp in order to answer the question correctly.
Graphing Functions
Graphing functions involves plotting points on a coordinate system to visualize the behavior of the function. For the function f(x) = (x−1) sin^−1 x, understanding its domain and range is crucial, especially since it is defined on the interval [-1, 1]. A graphing utility can help illustrate key features such as intercepts, maxima, minima, and asymptotic behavior.
Recommended video:

 5:53
5:53Graph of Sine and Cosine Function
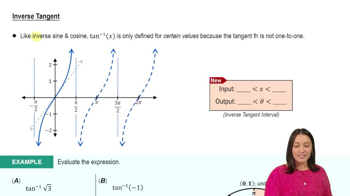
Inverse Sine Function
The inverse sine function, denoted as sin^−1 x or arcsin x, is the function that returns the angle whose sine is x. Its range is limited to [-π/2, π/2], which is important when analyzing the function f(x) = (x−1) sin^−1 x. Understanding how this function behaves within its domain helps in predicting the overall shape of f.
Recommended video:
 4:03
4:03Inverse Sine
Derivative and Its Graph
The derivative of a function, denoted as f', represents the rate of change of the function with respect to its variable. Graphing f' provides insights into the function's increasing or decreasing behavior, as well as its critical points. For f(x) = (x−1) sin^−1 x, calculating f' will reveal where the function has local maxima or minima, which is essential for a complete analysis.
Recommended video:
 06:15
06:15Graphing The Derivative

Related Videos
Related Practice