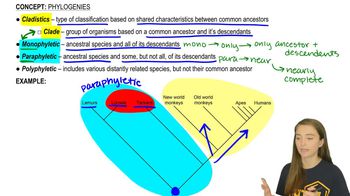
Table of contents
- 1. Introduction to Biology2h 40m
- 2. Chemistry3h 40m
- 3. Water1h 26m
- 4. Biomolecules2h 23m
- 5. Cell Components2h 26m
- 6. The Membrane2h 31m
- 7. Energy and Metabolism2h 0m
- 8. Respiration2h 40m
- 9. Photosynthesis2h 49m
- 10. Cell Signaling59m
- 11. Cell Division2h 47m
- 12. Meiosis2h 0m
- 13. Mendelian Genetics4h 41m
- Introduction to Mendel's Experiments7m
- Genotype vs. Phenotype17m
- Punnett Squares13m
- Mendel's Experiments26m
- Mendel's Laws18m
- Monohybrid Crosses16m
- Test Crosses14m
- Dihybrid Crosses20m
- Punnett Square Probability26m
- Incomplete Dominance vs. Codominance20m
- Epistasis7m
- Non-Mendelian Genetics12m
- Pedigrees6m
- Autosomal Inheritance21m
- Sex-Linked Inheritance43m
- X-Inactivation9m
- 14. DNA Synthesis2h 27m
- 15. Gene Expression3h 20m
- 16. Regulation of Expression3h 31m
- Introduction to Regulation of Gene Expression13m
- Prokaryotic Gene Regulation via Operons27m
- The Lac Operon21m
- Glucose's Impact on Lac Operon25m
- The Trp Operon20m
- Review of the Lac Operon & Trp Operon11m
- Introduction to Eukaryotic Gene Regulation9m
- Eukaryotic Chromatin Modifications16m
- Eukaryotic Transcriptional Control22m
- Eukaryotic Post-Transcriptional Regulation28m
- Eukaryotic Post-Translational Regulation13m
- 17. Viruses37m
- 18. Biotechnology2h 58m
- 19. Genomics17m
- 20. Development1h 5m
- 21. Evolution3h 1m
- 22. Evolution of Populations3h 52m
- 23. Speciation1h 37m
- 24. History of Life on Earth2h 6m
- 25. Phylogeny2h 31m
- 26. Prokaryotes4h 59m
- 27. Protists1h 12m
- 28. Plants1h 22m
- 29. Fungi36m
- 30. Overview of Animals34m
- 31. Invertebrates1h 2m
- 32. Vertebrates50m
- 33. Plant Anatomy1h 3m
- 34. Vascular Plant Transport2m
- 35. Soil37m
- 36. Plant Reproduction47m
- 37. Plant Sensation and Response1h 9m
- 38. Animal Form and Function1h 19m
- 39. Digestive System10m
- 40. Circulatory System1h 57m
- 41. Immune System1h 12m
- 42. Osmoregulation and Excretion50m
- 43. Endocrine System4m
- 44. Animal Reproduction2m
- 45. Nervous System55m
- 46. Sensory Systems46m
- 47. Muscle Systems23m
- 48. Ecology3h 11m
- Introduction to Ecology20m
- Biogeography14m
- Earth's Climate Patterns50m
- Introduction to Terrestrial Biomes10m
- Terrestrial Biomes: Near Equator13m
- Terrestrial Biomes: Temperate Regions10m
- Terrestrial Biomes: Northern Regions15m
- Introduction to Aquatic Biomes27m
- Freshwater Aquatic Biomes14m
- Marine Aquatic Biomes13m
- 49. Animal Behavior28m
- 50. Population Ecology3h 41m
- Introduction to Population Ecology28m
- Population Sampling Methods23m
- Life History12m
- Population Demography17m
- Factors Limiting Population Growth14m
- Introduction to Population Growth Models22m
- Linear Population Growth6m
- Exponential Population Growth29m
- Logistic Population Growth32m
- r/K Selection10m
- The Human Population22m
- 51. Community Ecology2h 46m
- Introduction to Community Ecology2m
- Introduction to Community Interactions9m
- Community Interactions: Competition (-/-)38m
- Community Interactions: Exploitation (+/-)23m
- Community Interactions: Mutualism (+/+) & Commensalism (+/0)9m
- Community Structure35m
- Community Dynamics26m
- Geographic Impact on Communities21m
- 52. Ecosystems2h 36m
- 53. Conservation Biology24m
25. Phylogeny
Phylogeny
Problem 7b
Textbook Question
Textbook QuestionVISUAL SKILLS The relative lengths of the frog and mouse branches in the phylogenetic tree in Figure 26.13 indicate that a. frogs evolved before mice. b. mice evolved before frogs. c. the homolog has evolved more rapidly in mice. d. the homolog has evolved more slowly in mice.
![](/channels/images/assetPage/verifiedSolution.png)
1
Identify the phylogenetic tree in Figure 26.13 and observe the lengths of the branches for frogs and mice.
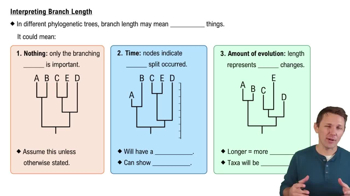
Understand that in a phylogenetic tree, the length of the branch can represent the amount of evolutionary change or the rate of evolution.
Compare the lengths of the branches for frogs and mice. A longer branch suggests a faster rate of evolution for that particular lineage.
Determine which branch is longer between the frog and the mouse. If the mouse's branch is longer, it indicates that the homolog has evolved more rapidly in mice.
Select the correct answer based on the observation: if the mouse's branch is longer, the correct answer is 'c. the homolog has evolved more rapidly in mice.'
Recommended similar problem, with video answer:
![](/channels/images/assetPage/verifiedSolution.png)
This video solution was recommended by our tutors as helpful for the problem above
Video duration:
49sPlay a video:
Was this helpful?
Key Concepts
Here are the essential concepts you must grasp in order to answer the question correctly.
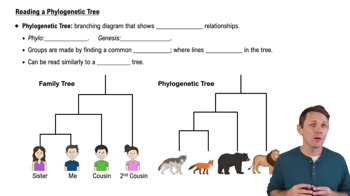
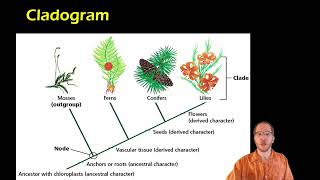
Phylogenetic Trees
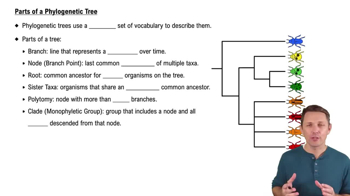
Phylogenetic trees are diagrams that represent the evolutionary relationships among various biological species based on their genetic or physical characteristics. The branches of the tree indicate how closely related different species are, with the length of the branches often reflecting the amount of evolutionary change or time since divergence.
Recommended video:
Building Phylogenetic Trees Example 2
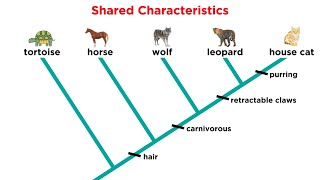
Homologous Structures
Homologous structures are anatomical features in different species that share a common ancestry, even if their functions may differ. The study of homologs helps scientists understand evolutionary relationships and the processes of adaptation and divergence among species.
Recommended video:
Guided course
Homologous Chromosomes
Evolutionary Rates
Evolutionary rates refer to the speed at which genetic changes occur in a lineage over time. These rates can vary significantly between species, influenced by factors such as environmental pressures and reproductive strategies, and can be inferred from the lengths of branches in a phylogenetic tree, indicating how quickly certain traits have evolved.
Recommended video:
History of Evolutionary Theory Example 1
Watch next
Master Reading a Phylogenetic Tree with a bite sized video explanation from Bruce Bryan
Start learningRelated Videos
Related Practice