50. Population Ecology
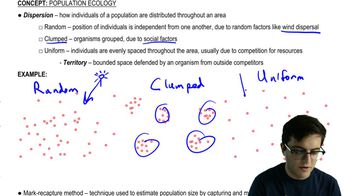
Introduction to Population Ecology
Problem 11a
Textbook Question
What is survivorship? What does a survivorship curve show? Explain what the three survivorship curves tell us about humans, squirrels, and clams.
 Verified step by step guidance
1
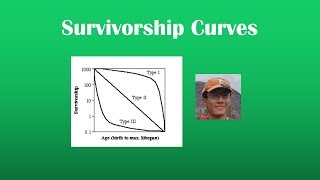
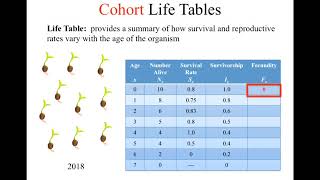
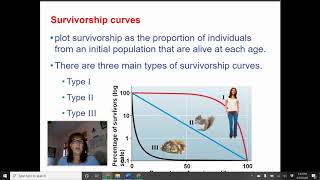
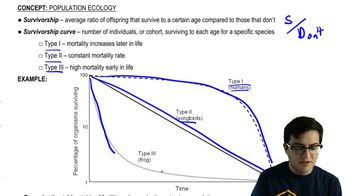
Survivorship refers to the percentage of a population that survives to a particular age. It is often represented graphically through survivorship curves, which plot the number of individuals surviving at each age against time.
A survivorship curve shows the pattern of survival over the lifespan of a species. It helps in understanding the mortality rate and survival probability of different species at various stages of their life.
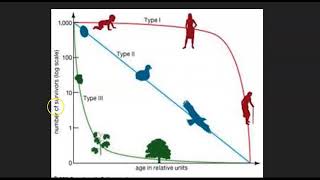
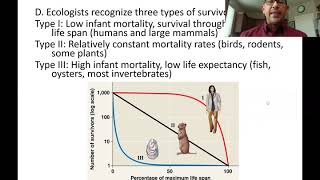
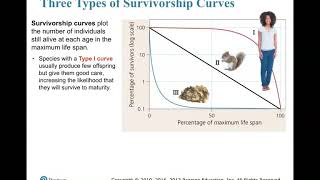
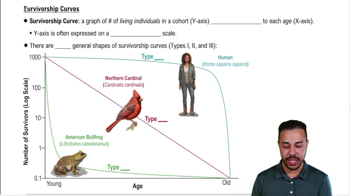
There are three types of survivorship curves: Type I, Type II, and Type III. Type I curves depict species that have high survival rates in the early and middle life, but experience a rapid decline in survival in later life stages. This is typical of humans who tend to live long lives but experience higher mortality rates as they age.
Type II curves represent species that have a relatively constant mortality rate throughout their life. This is seen in organisms like squirrels, where the chance of surviving remains consistent whether they are young or old.
Type III curves show species that have high mortality rates early in life, with few individuals surviving to adulthood. However, those that do survive to adulthood tend to live longer. This pattern is common in species like clams, where a large number of offspring are produced but very few survive to maturity.
Recommended similar problem, with video answer:
Verified SolutionThis video solution was recommended by our tutors as helpful for the problem above
Video duration:
2mWas this helpful?
Key Concepts
Here are the essential concepts you must grasp in order to answer the question correctly.
Survivorship
Survivorship refers to the proportion of individuals in a population that survive to a certain age. It is a key concept in ecology and demography, helping to understand population dynamics and life history strategies. Survivorship is often influenced by factors such as environmental conditions, predation, and reproductive strategies.
Recommended video:
Guided course
 03:15
03:15Survivorship
Survivorship Curve
A survivorship curve is a graphical representation that shows the number of individuals surviving at each age for a given species. There are three main types of survivorship curves: Type I (high survival in early and middle life, with a rapid decline in old age), Type II (constant mortality rate throughout life), and Type III (high mortality in early life, with survivors living longer). These curves provide insights into the life history traits of different species.
Recommended video:
Guided course
 02:54
02:54Survivorship Curves
Types of Survivorship Curves
The three types of survivorship curves illustrate different reproductive strategies and survival patterns among species. Type I, exemplified by humans, shows high survival rates in early and middle life. Type II, seen in squirrels, indicates a steady decline in survival regardless of age. Type III, characteristic of clams, reveals high mortality in early stages, with few surviving to adulthood, highlighting the trade-offs in reproductive strategies across species.
Recommended video:
Guided course
02:54Survivorship Curves
 1:17m
1:17mWatch next
Master Population Ecology with a bite sized video explanation from Jason Amores Sumpter
Start learningRelated Videos
Related Practice