50. Population Ecology
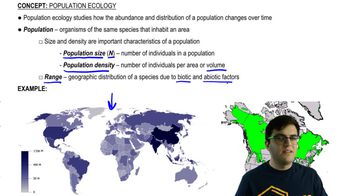
Introduction to Population Ecology
Problem 7b
Textbook Question
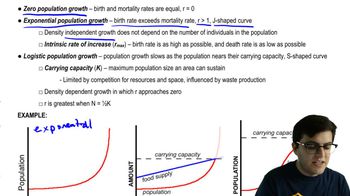
According to the logistic growth equation dNdt=rN(K−N)K a. the number of individuals added per unit time is greatest when N is close to zero. b. the per capita population growth rate increases as N approaches K. c. population growth is zero when N equals K. d. the population grows exponentially when K is small.
 Verified step by step guidance
1
1. The logistic growth equation is a model of population growth where the size of the population (N) affects the rate of change of the population (dN/dt). The equation is given as dN/dt = rN(K−N)/K, where r is the intrinsic rate of growth, K is the carrying capacity, and N is the population size.
2. Option a states that the number of individuals added per unit time is greatest when N is close to zero. This is incorrect. According to the logistic growth equation, when N is close to zero, the term (K-N) is almost equal to K, but the product of rN is also close to zero because N is small. Therefore, the number of individuals added per unit time is not greatest when N is close to zero.
3. Option b suggests that the per capita population growth rate increases as N approaches K. This is also incorrect. As N approaches K, the term (K-N) in the equation becomes smaller, leading to a decrease in the value of dN/dt, which means the per capita population growth rate decreases, not increases.
4. Option c states that population growth is zero when N equals K. This is correct. When N equals K, the term (K-N) becomes zero, making the entire right side of the equation zero. This means that the population growth rate (dN/dt) is zero, indicating no change in population size.
5. Option d suggests that the population grows exponentially when K is small. This is incorrect. The logistic growth model describes a population growth that is initially exponential but slows down as the population size approaches the carrying capacity (K). When K is small, it doesn't lead to exponential growth, but rather a quick saturation of the population to the small carrying capacity.
Recommended similar problem, with video answer:
Verified SolutionThis video solution was recommended by our tutors as helpful for the problem above
Video duration:
2mWas this helpful?
Key Concepts
Here are the essential concepts you must grasp in order to answer the question correctly.
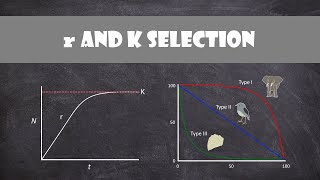
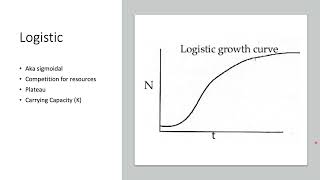
Logistic Growth Model
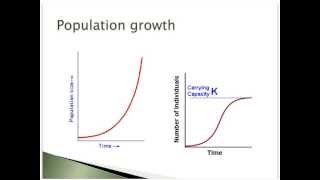
The logistic growth model describes how a population grows in an environment with limited resources. It is characterized by an initial exponential growth phase, followed by a slowdown as the population approaches the carrying capacity (K) of the environment. The equation dN/dt = rN(K-N)/K illustrates how the growth rate (dN/dt) depends on the current population size (N) and the carrying capacity.
Recommended video:
Guided course
 09:46
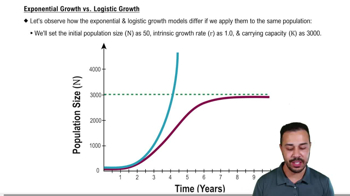
09:46Exponential Growth vs. Logistic Growth
Carrying Capacity (K)
Carrying capacity (K) is the maximum population size that an environment can sustain indefinitely without being degraded. As a population approaches K, the growth rate decreases due to limited resources, leading to a stabilization of the population size. Understanding K is crucial for predicting population dynamics and managing ecological systems.
Recommended video:
Guided course
 06:24
06:24Estimating Earth’s Human Carrying Capacity
Population Growth Rate
The population growth rate refers to the change in population size over time, influenced by factors such as birth rates, death rates, immigration, and emigration. In the logistic growth model, the per capita growth rate decreases as the population size (N) approaches the carrying capacity (K), indicating that resources become more limited and competition increases, ultimately leading to zero growth when N equals K.
Recommended video:
Guided course
 03:26
03:26Population Growth Rate vs. Per Capita Population Growth Rate
 1:17m
1:17mWatch next
Master Population Ecology with a bite sized video explanation from Jason Amores Sumpter
Start learningRelated Videos
Related Practice