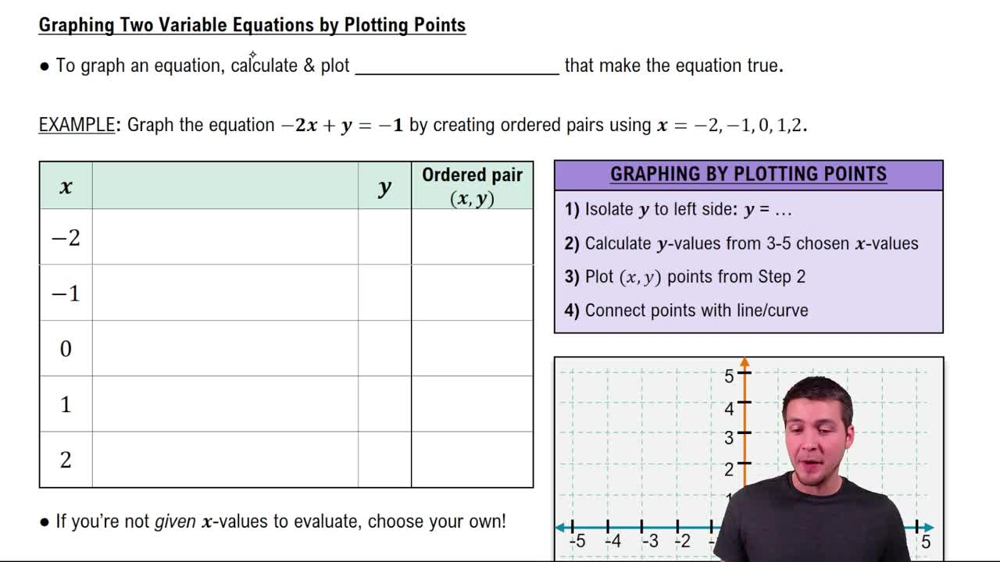
For each equation, (a) give a table with at least three ordered pairs that are solutions, and (b) graph the equation. See Examples 3 and 4. y = √(x - 3)
Verified step by step guidance
1
Step 1: Understand the equation given: \(y = \sqrt{x} - 3\). This means for each value of \(x\), \(y\) is the square root of \(x\) minus 3. Note that \(x\) must be greater than or equal to 0 because the square root function is only defined for non-negative numbers in the real number system.
Step 2: Create a table of ordered pairs \((x, y)\) by choosing at least three values of \(x\) that are greater than or equal to 0. For each chosen \(x\), calculate \(y\) using the formula \(y = \sqrt{x} - 3\). For example, pick \(x = 0\), \(x = 1\), and \(x = 4\) as starting points.
Step 3: Calculate the corresponding \(y\) values for each \(x\) chosen: For \(x=0\), \(y = \sqrt{0} - 3\); for \(x=1\), \(y = \sqrt{1} - 3\); for \(x=4\), \(y = \sqrt{4} - 3\). Write these as ordered pairs \((0, y_0)\), \((1, y_1)\), and \((4, y_4)\).
Step 4: Extend the table if needed by choosing additional \(x\) values to better understand the shape of the graph. Remember, the domain is \(x \geq 0\).
Step 5: To graph the equation, plot the ordered pairs from your table on the coordinate plane. Since \(y = \sqrt{x} - 3\) is a transformation of the basic square root function \(y = \sqrt{x}\) shifted down by 3 units, the graph will start at \((0, -3)\) and increase slowly as \(x\) increases.
Verified video answer for a similar problem:
This video solution was recommended by our tutors as helpful for the problem above
Video duration:
4m
Play a video:
0 Comments
Key Concepts
Here are the essential concepts you must grasp in order to answer the question correctly.
Domain of a Function
The domain refers to all possible input values (x-values) for which the function is defined. For y = √(x - 3), the expression under the square root must be non-negative, so x must be greater than or equal to 3. Understanding the domain ensures that only valid x-values are used when creating ordered pairs.
The square root function outputs the non-negative root of a number. In y = √(x - 3), the function shifts the basic square root graph right by 3 units. Recognizing this helps in plotting points and understanding the shape and behavior of the graph.
To graph the equation, first find ordered pairs (x, y) by substituting valid x-values into the function. Plot these points on the coordinate plane and connect them smoothly, reflecting the curve of the square root function. This process visualizes the relationship between x and y.

 Verified step by step guidance
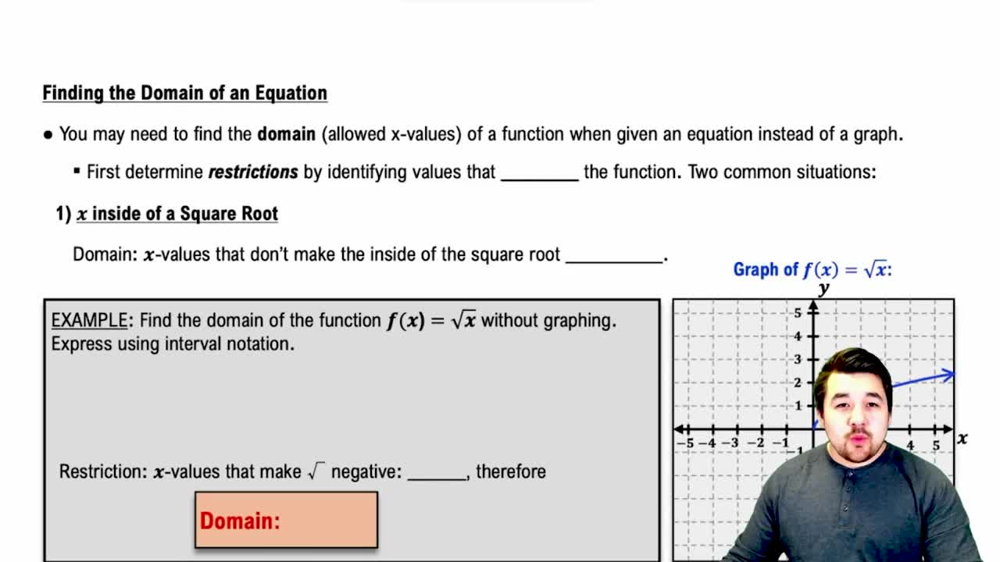
 3:43
3:43