Ch. R - Algebra Review
Lial - Trigonometry 12th Edition
Lial12th EditionTrigonometryISBN: 9780136552161Not the one you use?Change textbook
Chapter 1, Problem 57

Graph each function. See Examples 6–8. ƒ(x) = x² - 1

Verified step by step guidance
1
Recognize that the function ƒ(x) = x² - 1 is a quadratic function, which graphs as a parabola opening upwards because the coefficient of x² is positive.
Identify the vertex of the parabola. For a function in the form ƒ(x) = ax² + bx + c, the vertex x-coordinate is given by \(x = -\frac{b}{2a}\). Here, since b = 0, the vertex is at \(x = 0\).
Calculate the y-coordinate of the vertex by substituting \(x = 0\) into the function: \(ƒ(0) = 0^2 - 1 = -1\). So, the vertex is at the point \((0, -1)\).
Determine the y-intercept by evaluating ƒ(0), which we already found to be -1. This confirms the parabola crosses the y-axis at (0, -1).
Find additional points by choosing values of x (for example, x = 1 and x = -1), calculate their corresponding y-values using \(ƒ(x) = x^2 - 1\), and plot these points to help sketch the parabola accurately.

Verified video answer for a similar problem:

This video solution was recommended by our tutors as helpful for the problem above.
Video duration:
4m
Was this helpful?

Key Concepts

Here are the essential concepts you must grasp in order to answer the question correctly.

Understanding Function Graphs

Graphing a function involves plotting points (x, f(x)) on the coordinate plane to visualize the relationship between input and output values. For ƒ(x) = x² - 1, this means calculating y-values for various x-values and plotting them to see the shape of the curve.
Recommended video:
5:53
Graph of Sine and Cosine Function

Parabola and Quadratic Functions

The function ƒ(x) = x² - 1 is a quadratic function, whose graph is a parabola opening upwards. The coefficient of x² determines the direction and width of the parabola, while the constant term shifts it vertically.
Recommended video:
6:36
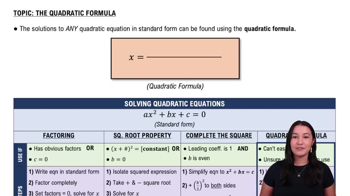
Quadratic Formula

Vertex and Axis of Symmetry

The vertex of the parabola ƒ(x) = x² - 1 is the point where the graph changes direction, here at (0, -1). The axis of symmetry is the vertical line x = 0, which divides the parabola into two mirror-image halves.
Recommended video:
3:19
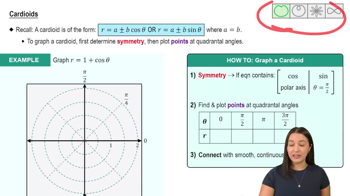
Cardioids