Ch. 2 - Graphs of the Trigonometric Functions; Inverse Trigonometric Functions
Blitzer - Trigonometry 3rd Edition
Blitzer3rd EditionTrigonometryISBN: 9780137316601Not the one you use?Change textbook
Chapter 2, Problem 15

In Exercises 14–15, use the method of adding y-coordinates to graph each function for 0 ≤ x ≤ 2π. y = sin x + cos 1/2 x

Verified step by step guidance
1
Identify the two separate functions involved: \( y_1 = \sin x \) and \( y_2 = \cos \frac{1}{2} x \). We will graph each function individually over the interval \( 0 \leq x \leq 2\pi \).
Create a table of values for \( y_1 = \sin x \) by choosing key points in the interval \( 0, \frac{\pi}{2}, \pi, \frac{3\pi}{2}, 2\pi \) and calculating \( \sin x \) at these points.
Similarly, create a table of values for \( y_2 = \cos \frac{1}{2} x \) using the same \( x \)-values, but calculate \( \cos \left( \frac{1}{2} x \right) \) at each point.
Add the corresponding \( y \)-coordinates from the two tables to find the values of \( y = \sin x + \cos \frac{1}{2} x \) at each \( x \)-value. This means for each \( x \), compute \( y = y_1 + y_2 \).
Plot the points \( (x, y) \) obtained from the sums on the coordinate plane and connect them smoothly to graph the function \( y = \sin x + \cos \frac{1}{2} x \) over the interval \( 0 \leq x \leq 2\pi \).

Verified video answer for a similar problem:

This video solution was recommended by our tutors as helpful for the problem above.
Video duration:
3m
Was this helpful?

Key Concepts

Here are the essential concepts you must grasp in order to answer the question correctly.

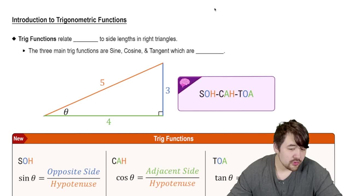
Graphing Trigonometric Functions

Graphing trigonometric functions involves plotting points based on their values at various x-coordinates, typically over one or more periods. Understanding the shape and period of sine and cosine functions helps in accurately sketching their graphs.
Recommended video:
6:04
Introduction to Trigonometric Functions

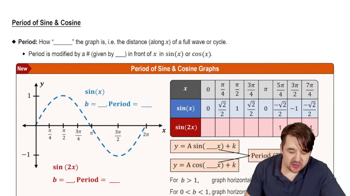
Period and Frequency of Trigonometric Functions

The period of a trigonometric function is the length of one complete cycle. For y = cos(1/2 x), the period is 4π because the frequency is halved. Recognizing how coefficients inside the function affect the period is essential for correct graphing.
Recommended video:
5:33
Period of Sine and Cosine Functions

Adding Functions by Summing y-Coordinates

When adding two functions, the resulting graph is found by adding their y-values at each x-coordinate. This method requires calculating y-values of each function separately and then summing them to get the combined function's graph.
Recommended video:
5:20
Example 7