Ch. R - Algebra Review
Lial - Trigonometry 12th Edition
Lial12th EditionTrigonometryISBN: 9780136552161Not the one you use?Change textbook
Chapter 1, Problem 23

Graph each function. See Examples 1 and 2. ƒ(x) = -½ x²

Verified step by step guidance
1
Identify the type of function given. Here, ƒ(x) = -\(\frac{1}{2}\) x^{2} is a quadratic function, which graphs as a parabola.
Note the coefficient of x², which is -\(\frac{1}{2}\). Since it is negative, the parabola opens downward, and the factor \(\frac{1}{2}\) affects the width, making it wider than the standard parabola y = -x².
Determine the vertex of the parabola. For the function ƒ(x) = a x^{2} + bx + c, the vertex is at x = -\(\frac{b}{2a}\). Here, b = 0, so the vertex is at x = 0. Calculate ƒ(0) to find the vertex point.
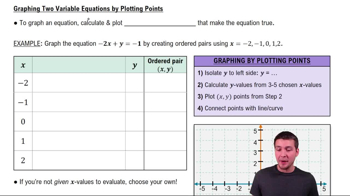
Create a table of values by choosing x-values around the vertex (for example, x = -2, -1, 0, 1, 2), then compute the corresponding y-values using the function ƒ(x) = -\(\frac{1}{2}\) x^{2}.
Plot the points from the table on the coordinate plane and draw a smooth curve through them to complete the graph of the parabola.

Verified video answer for a similar problem:

This video solution was recommended by our tutors as helpful for the problem above.
Video duration:
6m
Was this helpful?

Key Concepts

Here are the essential concepts you must grasp in order to answer the question correctly.

Quadratic Functions and Their Graphs

A quadratic function is a polynomial of degree two, typically written as f(x) = ax² + bx + c. Its graph is a parabola that opens upwards if a > 0 and downwards if a < 0. Understanding the shape and orientation of the parabola is essential for graphing.
Recommended video:
6:36
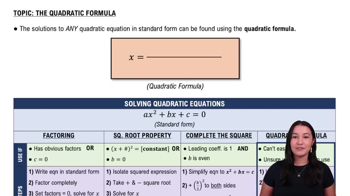
Quadratic Formula

Effect of the Leading Coefficient

The leading coefficient (a) affects the width and direction of the parabola. A negative coefficient, like -½, flips the parabola downward, while its absolute value controls how 'wide' or 'narrow' the curve appears. Smaller absolute values make the parabola wider.
Recommended video:
6:24
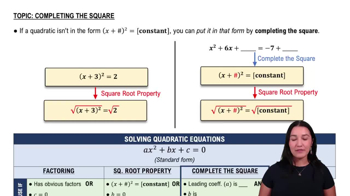
Solving Quadratic Equations by Completing the Square

Plotting Key Points and Vertex

To graph a quadratic function, identify the vertex (the highest or lowest point) and plot additional points by substituting x-values. For f(x) = -½ x², the vertex is at the origin (0,0), and points on either side help define the parabola's shape.
Recommended video:
4:29
Graphing Two Variable Equations by Plotting Points