Ch. 5 - Complex Numbers, Polar Coordinates and Parametric Equations
Blitzer - Trigonometry 3rd Edition
Blitzer3rd EditionTrigonometryISBN: 9780137316601Not the one you use?Change textbook
Chapter 5, Problem 11

Use point plotting to graph the plane curve described by the given parametric equations. Use arrows to show the orientation of the curve corresponding to increasing values of t. x = t − 2, y = 2t + 1; −2 ≤ t ≤ 3

Verified step by step guidance
1
Identify the parametric equations given: \(x = t - 2\) and \(y = 2t + 1\), with the parameter \(t\) ranging from \(-2\) to \(3\).
Create a table of values by choosing several values of \(t\) within the interval \([-2, 3]\). For each chosen \(t\), calculate the corresponding \(x\) and \(y\) coordinates using the parametric equations.
Plot each point \((x, y)\) on the Cartesian plane based on the values obtained from the table. This will give you a set of points that lie on the curve.
Draw a smooth curve through the plotted points to represent the parametric curve. Since \(t\) increases from \(-2\) to \(3\), add arrows along the curve to indicate the direction of increasing \(t\).
Analyze the shape and orientation of the curve by observing how \(x\) and \(y\) change as \(t\) increases, confirming the correct direction of the arrows and the overall behavior of the curve.

Verified video answer for a similar problem:

This video solution was recommended by our tutors as helpful for the problem above.
Video duration:
7m
Was this helpful?

Key Concepts

Here are the essential concepts you must grasp in order to answer the question correctly.

Parametric Equations

Parametric equations express the coordinates of points on a curve as functions of a parameter, usually denoted t. Instead of y as a function of x, both x and y depend on t, allowing the description of more complex curves and motions.
Recommended video:
08:02
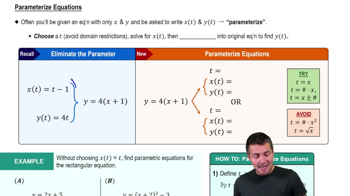
Parameterizing Equations

Plotting Points from Parametric Equations

To graph a parametric curve, calculate (x, y) pairs by substituting values of t within the given interval. Plot these points on the coordinate plane and connect them smoothly to visualize the curve's shape.
Recommended video:
08:02
Parameterizing Equations

Orientation and Direction of Parametric Curves

The orientation of a parametric curve shows the direction in which the curve is traced as the parameter t increases. Arrows on the graph indicate this direction, helping to understand the curve's progression over the parameter interval.
Recommended video:
04:47
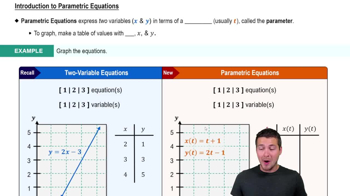
Introduction to Parametric Equations