4. Graphing Trigonometric Functions
Graphs of Tangent and Cotangent Functions
Problem 4.33b
Textbook Question
Graph each function over a two-period interval.
y = -1 + 2 tan x
 Verified step by step guidance
1
<Step 1: Understand the basic form of the tangent function. The standard form is \( y = a \tan(bx - c) + d \). In this case, \( a = 2 \), \( b = 1 \), \( c = 0 \), and \( d = -1 \).>
<Step 2: Determine the period of the function. The period of \( \tan(bx) \) is \( \frac{\pi}{b} \). Since \( b = 1 \), the period is \( \pi \).>
<Step 3: Identify the vertical shift. The \( d \) value in the equation \( y = a \tan(bx - c) + d \) represents a vertical shift. Here, \( d = -1 \), so the graph is shifted down by 1 unit.>
<Step 4: Identify the vertical stretch. The \( a \) value affects the steepness of the graph. Here, \( a = 2 \), which means the graph is vertically stretched by a factor of 2.>
<Step 5: Graph the function over a two-period interval. Since the period is \( \pi \), graph the function from \( x = -\pi \) to \( x = \pi \) to cover two periods. Consider the vertical shift and stretch when plotting key points and asymptotes.>
Recommended similar problem, with video answer:
Verified SolutionThis video solution was recommended by our tutors as helpful for the problem above
Video duration:
0m:0sWas this helpful?
Key Concepts
Here are the essential concepts you must grasp in order to answer the question correctly.
Tangent Function
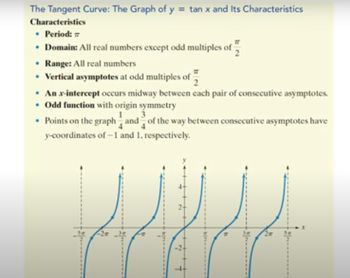
The tangent function, denoted as tan(x), is a periodic function defined as the ratio of the sine and cosine functions: tan(x) = sin(x)/cos(x). It has a period of π, meaning it repeats its values every π radians. Understanding its behavior, including its asymptotes and points of discontinuity, is crucial for graphing.
Recommended video:

 5:43
5:43Introduction to Tangent Graph
Vertical Transformations
Vertical transformations involve shifting a function up or down on the graph. In the function y = -1 + 2 tan x, the '-1' indicates a downward shift of the entire graph by one unit. This transformation affects the y-values of the function without altering its shape or period.
Recommended video:
 5:25
5:25Introduction to Transformations
Amplitude and Stretching
In trigonometric functions, amplitude typically refers to the height of the wave from its midline. However, for the tangent function, which does not have a maximum or minimum value, the coefficient '2' in '2 tan x' indicates a vertical stretch. This means the function's values will be scaled by a factor of 2, affecting the steepness of the graph.
Recommended video:
 6:02
6:02Stretches and Shrinks of Functions
 5:43m
5:43mWatch next
Master Introduction to Tangent Graph with a bite sized video explanation from Nick Kaneko
Start learningRelated Videos
Related Practice