
Textbook Question
Graph each function over a one-period interval.
y = ½ sec x
920
views

 Verified step by step guidance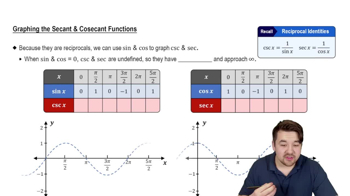
 6:22
6:22
 4:22
4:22 5:33
5:33Graph each function over a one-period interval.
y = ½ sec x
Graph each function over the interval [-2π, 2π]. Give the amplitude. See Example 1.
y = -2 sin x
Graph each function over a one-period interval.
y = 1 - (1/2) csc (x - 3π/4)
Graph each function over a two-period interval. Give the period and amplitude. See Examples 2–5.
y = ½ cos π x
2
A rotating beacon is located at point A, 4 m from a wall. The distance a is given by
a = 4 |sec 2πt|,
where t is time in seconds since the beacon started rotating. Find the value of a for each time t. Round to the nearest tenth if applicable.
<IMAGE>
t = 1.24
Fill in the blank(s) to correctly complete each sentence.
The graph of y = 4 sin x is obtained by stretching the graph of y = sin x vertically by a factor of ________.