Graph each function over a two-period interval. y = 1 + tan x
Verified step by step guidance
1
Identify the function to be graphed: \(y = 1 + \tan x\). This is a vertical shift of the basic tangent function by 1 unit upwards.
Recall the period of the tangent function. The basic tangent function \(\tan x\) has a period of \(\pi\), so two periods correspond to an interval of length \(2\pi\).
Determine the interval over which to graph the function. For two periods, choose an interval such as \([-\pi, \pi]\) or \([0, 2\pi]\).
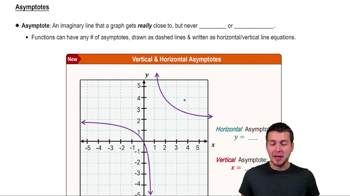
Note the vertical asymptotes of \(\tan x\), which occur where \(\cos x = 0\), i.e., at \(x = \frac{\pi}{2} + k\pi\) for any integer \(k\). These asymptotes will also be shifted vertically but remain at the same \(x\)-values.
Plot key points of \(\tan x\) within the chosen interval, then shift all \(y\)-values up by 1 to graph \(y = 1 + \tan x\). Mark the vertical asymptotes and sketch the curve approaching these asymptotes accordingly.
Verified video answer for a similar problem:
This video solution was recommended by our tutors as helpful for the problem above
Play a video:
0 Comments
Key Concepts
Here are the essential concepts you must grasp in order to answer the question correctly.
Periodicity of the Tangent Function
The tangent function has a fundamental period of π, meaning its values repeat every π units. Understanding this periodicity is essential for graphing the function over a specified interval, such as two periods, which would be 2π for tangent.
Tangent has vertical asymptotes where the function is undefined, occurring at odd multiples of π/2. Recognizing these asymptotes helps in accurately sketching the graph, as the function approaches infinity near these points.
The function y = 1 + tan x represents a vertical shift of the basic tangent graph upward by 1 unit. Understanding vertical translations allows you to adjust the graph accordingly without altering its shape or period.

 Verified step by step guidance
 5:43
5:43