Ch. 2 - Graphs of the Trigonometric Functions; Inverse Trigonometric Functions
Blitzer - Trigonometry 3rd Edition
Blitzer3rd EditionTrigonometryISBN: 9780137316601Not the one you use?Change textbook
Chapter 2, Problem 75

In Exercises 75–78, graph one period of each function. y = |2 cos x/2|

Verified step by step guidance
1
Identify the function to be graphed: \(y = |2 \cos \frac{x}{2}|\). Notice that the function involves the cosine of \(\frac{x}{2}\), scaled by 2, and then the absolute value is taken.
Determine the period of the inner cosine function. The standard cosine function \(\cos x\) has a period of \(2\pi\). Since the argument is \(\frac{x}{2}\), the period \(T\) is given by \(T = \frac{2\pi}{\frac{1}{2}} = 4\pi\).
Set the domain for one period of the function from \(x = 0\) to \(x = 4\pi\) to capture one full cycle of \(\cos \frac{x}{2}\).
Calculate key points within this interval where the cosine function reaches its maximum, minimum, and zeros. For example, find values of \(x\) where \(\cos \frac{x}{2} = 1, 0, -1\), then apply the transformations: multiply by 2 and take the absolute value.
Plot these points and sketch the graph by connecting them smoothly, remembering that the absolute value makes all negative values positive, so the graph will be reflected above the x-axis wherever \(2 \cos \frac{x}{2}\) is negative.

Verified video answer for a similar problem:

This video solution was recommended by our tutors as helpful for the problem above.
Video duration:
8m
Was this helpful?

Key Concepts

Here are the essential concepts you must grasp in order to answer the question correctly.

Period of a Trigonometric Function

The period of a trigonometric function is the length of the interval over which the function completes one full cycle before repeating. For functions like cosine, the standard period is 2π, but it changes when the function's argument is scaled, such as cos(bx), where the period becomes 2π/|b|.
Recommended video:
5:33
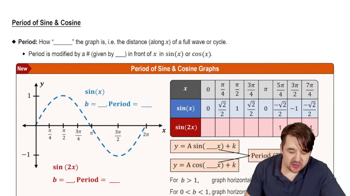
Period of Sine and Cosine Functions

Effect of Absolute Value on Trigonometric Graphs

Applying the absolute value to a trigonometric function, like y = |f(x)|, reflects all negative values of the function above the x-axis, making the entire graph non-negative. This transformation alters the shape by 'folding' the parts below the x-axis upward, affecting the graph's appearance but not its period.
Recommended video:
5:08
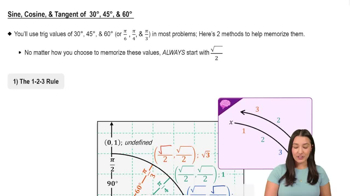
Sine, Cosine, & Tangent of 30°, 45°, & 60°

Graphing Scaled Trigonometric Functions

When the input of a trigonometric function is scaled, such as cos(x/2), the graph stretches horizontally, increasing the period. Understanding how the coefficient inside the function affects the x-axis scaling is essential for accurately plotting one period of the function.
Recommended video:
6:04
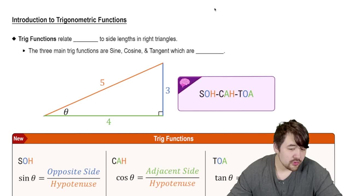
Introduction to Trigonometric Functions