
Textbook Question
Graph each function over a two-period interval. Give the period and amplitude. See Examples 2–5.
y = -2 sin 2 πx
855
views

 Verified step by step guidance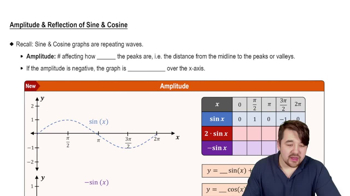
 5:05
5:05
 5:53
5:53 6:04
6:04Graph each function over a two-period interval. Give the period and amplitude. See Examples 2–5.
y = -2 sin 2 πx
Graph each function over a one-period interval.
y = csc((1/2)x - π/4)
Graph each function over a two-period interval. Give the period and amplitude. See Examples 2–5.
y = 2 sin ¼ x
Graph each function over a two-period interval. Give the period and amplitude. See Examples 2–5.
y = π sin πx
Decide whether each statement is true or false. If false, explain why.
The graph of y = sec x in Figure 37 suggests that sec(-x) = sec x for all x in the domain of sec x.
Graph each function over a one-period interval.
y = csc (x - π/4)