Ch. R - Algebra Review
Lial - Trigonometry 12th Edition
Lial12th EditionTrigonometryISBN: 9780136552161Not the one you use?Change textbook
Chapter 1, Problem 25

Graph each function. See Examples 1 and 2. ƒ(x) = -3|x|

Verified step by step guidance
1
Recognize that the function ƒ(x) = -3|x| is a transformation of the basic absolute value function ƒ(x) = |x|, which has a V-shaped graph with its vertex at the origin (0,0).
Understand that the absolute value function |x| outputs the distance of x from zero, so it is always non-negative. Multiplying by -3 will reflect the graph across the x-axis and stretch it vertically by a factor of 3.
Start by plotting key points of the basic function |x|, such as (0,0), (1,1), and (-1,1). Then apply the transformation to these points by multiplying their y-values by -3, resulting in (0,0), (1,-3), and (-1,-3).
Draw the graph by connecting these transformed points with straight lines, forming a V-shape opening downward because of the negative coefficient.
Label the vertex at the origin and note the slope of the lines on either side of the vertex: the left side has slope 3 (since the original slope -1 is multiplied by -3), and the right side has slope -3.

Verified video answer for a similar problem:

This video solution was recommended by our tutors as helpful for the problem above.
Video duration:
6m
Was this helpful?

Key Concepts

Here are the essential concepts you must grasp in order to answer the question correctly.

Absolute Value Function

The absolute value function, denoted |x|, outputs the non-negative value of x, making all inputs positive or zero. Its graph is a V-shaped curve with the vertex at the origin, reflecting values symmetrically about the y-axis.
Recommended video:
7:28
Evaluate Composite Functions - Values Not on Unit Circle

Vertical Stretch and Reflection

Multiplying a function by a constant affects its graph's shape. A factor of -3 vertically stretches the graph by 3 times and reflects it across the x-axis, flipping the V-shape upside down and making it steeper.
Recommended video:
6:02
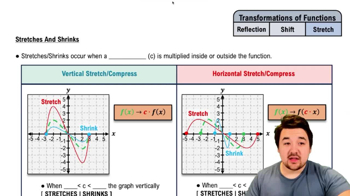
Stretches and Shrinks of Functions

Graphing Piecewise Functions

Absolute value functions can be expressed as piecewise linear functions, which helps in plotting. For ƒ(x) = -3|x|, the graph consists of two linear parts: y = -3x for x ≥ 0 and y = 3x for x < 0, joined at the vertex.
Recommended video:
5:53
Graph of Sine and Cosine Function