In Exercises 63–82, use a sketch to find the exact value of each expression. cos (sin⁻¹ 4/5)
Ch. 2 - Graphs of the Trigonometric Functions; Inverse Trigonometric Functions

All textbooks
Blitzer 3rd Edition
Ch. 2 - Graphs of the Trigonometric Functions; Inverse Trigonometric Functions
Problem 64
Blitzer 3rd Edition
Ch. 2 - Graphs of the Trigonometric Functions; Inverse Trigonometric Functions
Problem 64Chapter 2, Problem 64
In Exercises 61–66, use the method of adding y-coordinates to graph each function for 0 ≤ x ≤ 2π. y = cos x + cos 2x
Verified step by step guidance1
Identify the two functions involved: \(y_1 = \cos x\) and \(y_2 = \cos 2x\). We will graph each separately first for \(0 \leq x \leq 2\pi\).
Create a table of values for \(y_1 = \cos x\) by choosing several \(x\) values between \(0\) and \(2\pi\) (for example, \(0\), \(\frac{\pi}{2}\), \(\pi\), \(\frac{3\pi}{2}\), \(2\pi\)) and calculate the corresponding \(y_1\) values.
Similarly, create a table of values for \(y_2 = \cos 2x\) using the same \(x\) values, noting that the frequency is doubled, so the function completes two full cycles between \(0\) and \(2\pi\).
For each \(x\) value, add the corresponding \(y\)-coordinates from \(y_1\) and \(y_2\) to find the combined function value: \(y = \cos x + \cos 2x\).
Plot the points \((x, y)\) on the coordinate plane and connect them smoothly to graph the function \(y = \cos x + \cos 2x\) over the interval \(0 \leq x \leq 2\pi\).

Verified video answer for a similar problem:
This video solution was recommended by our tutors as helpful for the problem above.
Video duration:
8mWas this helpful?
Key Concepts
Here are the essential concepts you must grasp in order to answer the question correctly.
Graphing Trigonometric Functions
Graphing trigonometric functions involves plotting points based on their values at various angles, typically measured in radians. Understanding the shape, period, amplitude, and phase shift of functions like cosine helps visualize their behavior over an interval such as 0 to 2π.
Recommended video:
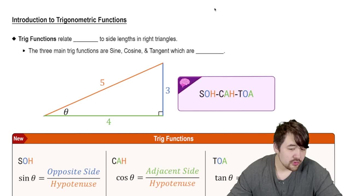
Introduction to Trigonometric Functions
Sum of Trigonometric Functions
When adding two trigonometric functions, the resulting graph is found by adding their y-coordinates point-by-point. This method combines the individual waveforms, producing a new function that reflects the superposition of the original functions' oscillations.
Recommended video:
Introduction to Trigonometric Functions
Period and Frequency of Cosine Functions
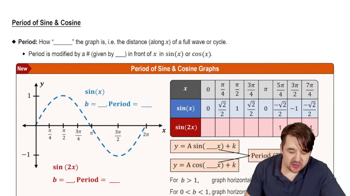
The period of a cosine function y = cos(kx) is given by 2π/k, indicating how often the function repeats. For y = cos x and y = cos 2x, their periods differ, affecting how their graphs combine when added, which is essential for accurately plotting the sum over 0 ≤ x ≤ 2π.
Recommended video:
Period of Sine and Cosine Functions
Related Practice
Textbook Question
658
views
Textbook Question
In Exercises 61–62, use the figures shown to find the bearing from O to A.
1054
views
Textbook Question
In Exercises 61–66, use the method of adding y-coordinates to graph each function for 0 ≤ x ≤ 2π. y = cos x + sin 2x
687
views
Textbook Question
In Exercises 61–66, use the method of adding y-coordinates to graph each function for 0 ≤ x ≤ 2π. y = 3 cos x + sin x
615
views
Textbook Question
In Exercises 65–66, an object moves in simple harmonic motion described by the given equation, where t is measured in seconds and d in centimeters. In each exercise, find: a. the maximum displacement b. the frequency c. the time required for one cycle. d = 20 cos π/4 t
800
views
Textbook Question
In Exercises 63–82, use a sketch to find the exact value of each expression. tan (cos⁻¹ 5/13)
716
views