Hey everyone. Whenever we worked with polynomial functions and we graphed them, we had to consider the end behavior of our graph, and this gave us great information so that we could easily graph our polynomial function. Now with rational functions, we're going to have to consider the behavior of our graph around things called asymptotes. Now asymptotes are lines that our curve or our graph is going to approach and get really, really close to but not quite touch. Just that word, asymptote, might make the graphs of rational functions sound like they're going to be complicated, but here we're going to graph a rational function together and I'm going to walk you through identifying asymptotes and the basics that you need to know about them. So let's go ahead and get started.
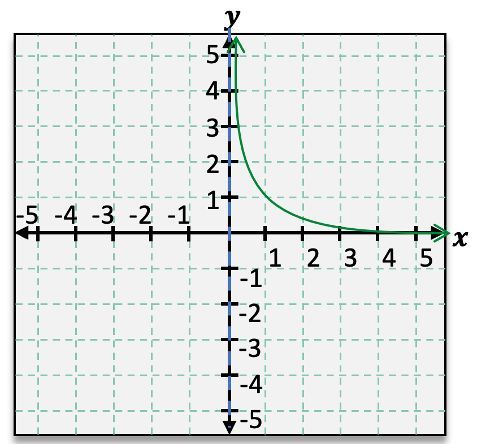
Now the first thing that I want to do here is just go ahead and graph a rational function. This function fx=1x is a really basic and common rational function that you're going to see. So let's go ahead and start with graphing the number 1 and plot those points on our graph. So if I plug in 1 to my function, that just gives me 1 divided by 1, which we know is just 1. Plotting that point on my graph, I have the point (1,1). Then, if I take 2, this is just 1 over 2. So I can also plot that on my graph at (2, 12). Then if I go to 3, this is just 1 over 3. So we're getting even smaller here on our graph. And if I take it all the way to 10 that's going to give me 1/10 or 0.1. We see that these numbers are getting progressively smaller. 1 over 100 is a much smaller number than 1. So what we're going to see happen on our graph is that we're going to get really, really close to the x-axis but not quite touch it. We're going to see the same thing happen on the negatives, but let's go ahead and verify that. I know that if I plug negative 1 in, I'm going to get negative 1. So I can go ahead and plot that point on my graph at (-1, -1). Then if I go to negative 10, I'm going to get negative 1/10, so we know that it's getting smaller in that negative direction. We're going to see a similar thing happen over here.
Now it's getting really, really close to that x-axis but not quite touching it, which is exactly what we said an asymptote is. So what I have here is an asymptote at my x-axis, which I represent using a dotted or dashed line. I'm going to go ahead and highlight it just so that it's easier to see here. But here I have a horizontal asymptote, because it's just a horizontal line, at y equals 0. Whenever we look at this asymptote, we see that our graph is getting really close to it but not quite touching it. And whenever we worked with the end behavior of polynomials, we described the behavior using arrow notation. We said that as x approached infinity, f of x approached something, for this particular graph, it's approaching infinity. And as x approaches negative infinity, here f of x is also approaching infinity.
Now we want to do the same thing with our rational function. Here as x approaches infinity, which is on this side of my graph, I see that f of x is instead approaching my asymptote at 0. So fx→0. Then, on the other side, as x approaches negative infinity, I know that the same thing is happening. I'm still approaching that asymptote at 0. So we can describe our end behavior still with arrow notation, but now it's getting close to that asymptote rather than going to negative or positive infinity.
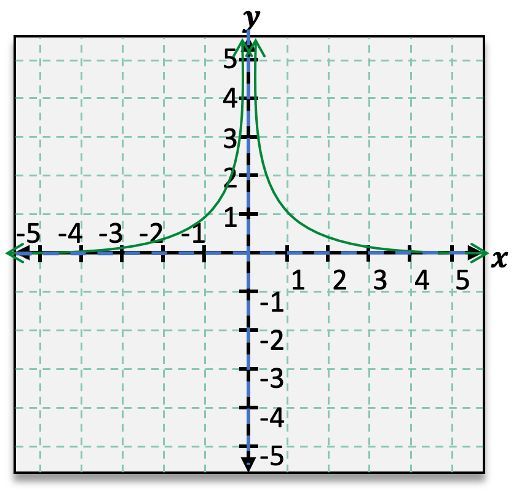
Let's go ahead and graph the rest of our function, because we still don't know what's happening in the middle here. Now if I take a look at some smaller numbers, between 0 and 1, like, say 0.1, that will give me 1 over 0.1, which is just 10. Then if I get even smaller, even closer to 0, and I take 1 over 0.01, that gets even bigger at 100. We're going to see our graph get really high up and get really close to my y-axis but not quite touch it. The same exact thing is going to happen over here. So I end up having two different curves on the graph of this rational function.
Whenever we consider that it's getting really close to the y-axis, that tells us that we're dealing with another asymptote. So I have an asymptote here on my y-axis, which I will again represent with a dashed line. I'm going to go ahead and highlight it again so that we can see it a little better. And this is a vertical asymptote at the line x equals 0. We see that our graph is approaching this asymptote from either side. And whenever we worked with polynomial functions, if we were to consider x approaching 0 and wanting to describe the behavior of our graph, we would just get a single point, in this case 0. Now, on our rational function, we see that our graph is approaching that line from either side, so that means we need to be able to describe both of these behaviors. We're going to split the behavior into two different sides. As x approaches 0 from the right side, which we denote as x approaching 0 with this little positive, that just means from the right. Here, as x approaches 0 from the right side, I see that my function is getting really, really high. It's approaching infinity. Then, as x approaches 0 from the left side, I see that it's going the opposite direction, so f of x is instead approaching negative infinity.
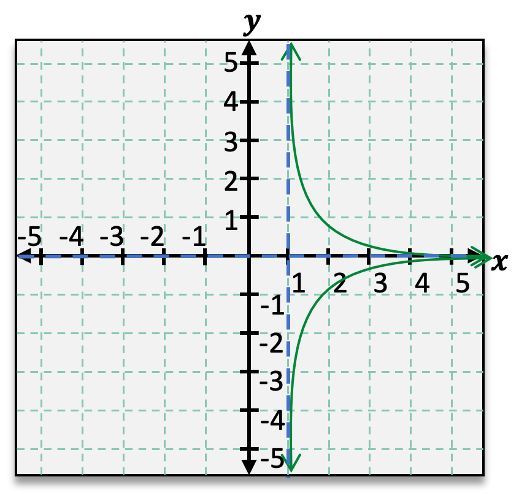
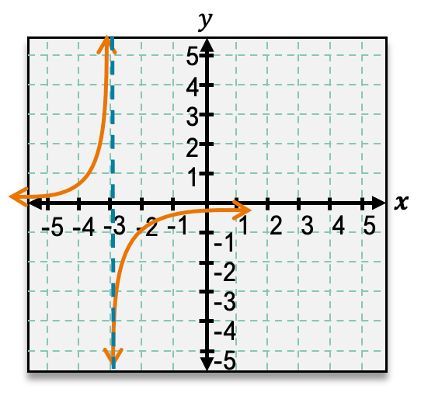
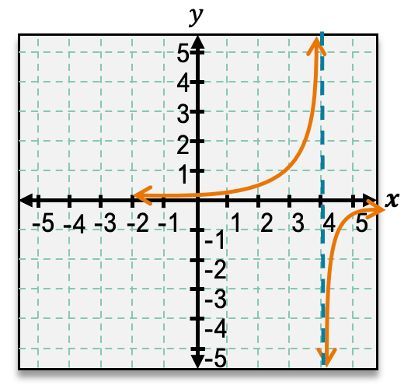
This is only we're only looking at 0 here because that's where our asymptote is and our asymptotes are not always going to be at 0; they just happen to be for this function. So this could really be any number. I could consider x approaching 2 or 5 from either side or any other number. It just depends on your function and where your asymptote is. And there can actually be a lot of different possibilities with asymptotes because a rational function may have no asymptotes. We may have just one asymptote like we see in this function here, or we can even have multiple asymptotes. But they're always going to be represented with these dashed lines. So if we look at function B here, I have a vertical and a horizontal asymptote kind of shifted from what we saw in our function up there. And then I could also even have multiple vertical asymptotes. It really just depends on your function. Now that we know the basics of asymptotes, let's go ahead and get to calculating them. I'll see you in the next video.