Table of contents
- 0. Fundamental Concepts of Algebra3h 29m
- 1. Equations and Inequalities3h 27m
- 2. Graphs1h 43m
- 3. Functions & Graphs2h 17m
- 4. Polynomial Functions1h 54m
- 5. Rational Functions1h 23m
- 6. Exponential and Logarithmic Functions2h 28m
- 7. Measuring Angles40m
- 8. Trigonometric Functions on Right Triangles2h 5m
- 9. Unit Circle1h 19m
- 10. Graphing Trigonometric Functions1h 19m
- 11. Inverse Trigonometric Functions and Basic Trig Equations1h 41m
- 12. Trigonometric Identities 2h 34m
- 13. Non-Right Triangles1h 38m
- 14. Vectors2h 25m
- 15. Polar Equations2h 5m
- 16. Parametric Equations1h 6m
- 17. Graphing Complex Numbers1h 7m
- 18. Systems of Equations and Matrices3h 6m
- 19. Conic Sections2h 36m
- 20. Sequences, Series & Induction1h 15m
- 21. Combinatorics and Probability1h 45m
- 22. Limits & Continuity1h 49m
- 23. Intro to Derivatives & Area Under the Curve2h 9m
16. Parametric Equations
Graphing Parametric Equations
Struggling with Precalculus?
Join thousands of students who trust us to help them ace their exams!Watch the first videoMultiple Choice
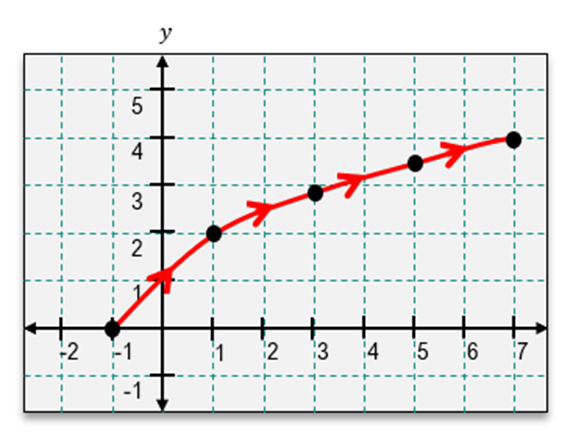
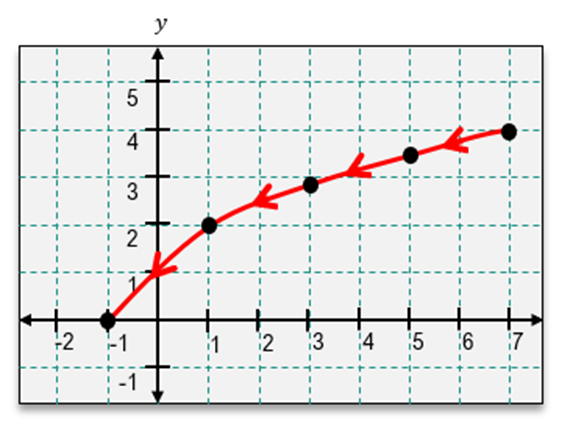
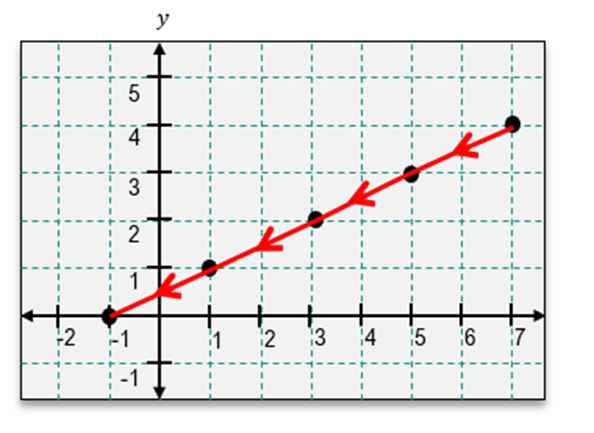
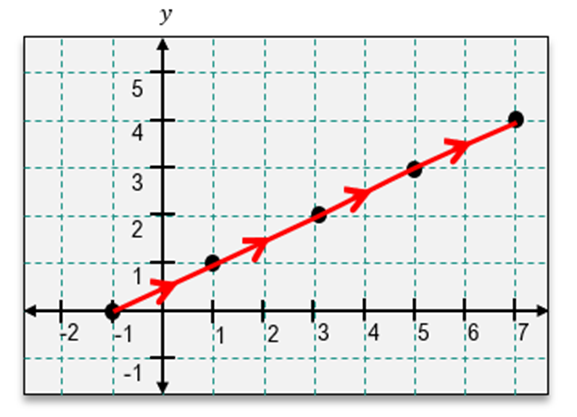
Graph the plane curve formed by the parametric equations and indicate its orientation.
x(t)=2t−1; y(t)=2t
t≥0
A
B
C
D

1
Start by understanding the parametric equations given: x(t) = 2t - 1 and y(t) = 2√t, with the condition t ≥ 0.
Determine the range of t values to plot the curve. Since t ≥ 0, you can start with t = 0 and choose several values of t to see how the curve behaves.
Calculate the corresponding x and y values for each chosen t value. For example, when t = 0, x(0) = 2(0) - 1 = -1 and y(0) = 2√0 = 0.
Plot the points (x(t), y(t)) on the graph for each t value. Connect these points smoothly to form the curve.
Indicate the orientation of the curve by drawing arrows along the curve in the direction of increasing t values. This shows the path traced by the curve as t increases.
Watch next
Master Introduction to Parametric Equations with a bite sized video explanation from Patrick
Start learningRelated Videos
Related Practice