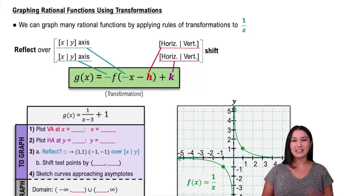
In this problem, we're asked to graph the given function as a transformation of 1/x2. And here, I have the function g(x)=-1(x-2)2. So let's go ahead and graph this, starting with step 1, which is to find our vertical asymptote and plot it at x=h. Now, looking at my function, knowing that this is a transformation of 1/x2, I want to go ahead and identify h, which, in this case, is just 2. So, I'm going to plot my vertical asymptote at x=2, using a dashed line.
Now, for step number 2, we want to plot our horizontal asymptote at y=k. In this case, I don't have a value for k; it's just 0 because it didn't get transformed. So y is simply 0 for my horizontal asymptote, and it's actually at the same exact place as the horizontal asymptote of my original function. So that didn't really get shifted.
Now, we want to move on to step 3 and identify if there is a reflection happening, which we can tell whether there is a negative outside or inside of our function. Here, my negative is right here, and it makes my entire function negative. So, I do have a reflection, and that reflection is over the x axis. So, I'm going to take these two test points or reference points that I have here, and I am going to go ahead and reflect them over the x axis accordingly. So, looking at my points, starting with 1, 1, remember, we can think of a reflection as folding it in half at the x axis and kind of stamping that point on the other side. So here 1, 1 will end up right here, and then -1, 1 will end up here, reflected over that x axis. Now, we want to go ahead and shift these points by h, k. And then h here is 2, k is simply 0. So, we're just going to shift these two points or two units over to the right. So, starting with my point at 1, -1 shifting that 2 over, it's going to end up right over here. And then my other point is going to get shifted 2 over. And it's actually going to end up exactly where my other point was, right here. So, I have my two new points that have been both reflected and shifted. And we can go ahead and move on to our final step and simply sketch our curves approaching our asymptotes.
So let's go ahead and do that here. Approaching my asymptote on either side, I know that the shape is the exact same as my original 1/x2, but we've just been reflected and shifted. So here's my new function. We have fully crafted. Let's go ahead and identify our domain and our range. Now, our domain is going to go from negative infinity until we reach our asymptote where it's going to stop and then continue on the other side of my asymptote. So from negative infinity to my asymptote here is negative infinity to 2 and then from 2 to infinity.
Now as for my range, because we're only on one side of our x axis here, we only go from negative infinity up until we reach that asymptote, which happens to be at the x axis. If we were up here, our range would be different. But since we're down here, it goes from negative infinity until 0, where that asymptote is.
Now that we've graphed with this transformation and identified our domain and our range, thanks for watching, and I'll see you in the next video.