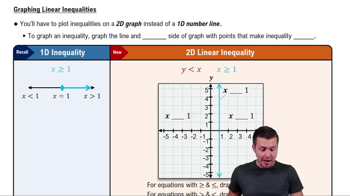
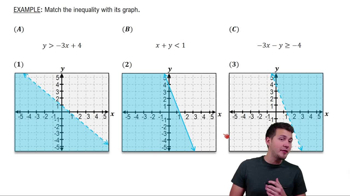
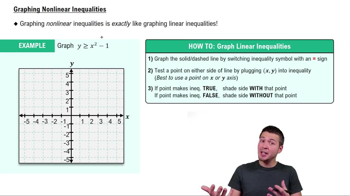
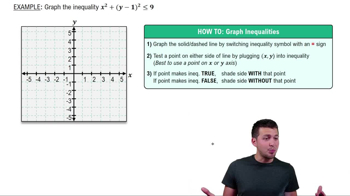
Everyone, welcome back. So, up until now, we've seen how to graph an individual inequality, something that looks like this. The basic idea was that we would draw this inequality and test the points, and then we would shade the area, an area that makes that inequality true with those points. But now, we're actually going to see some problems that have multiple inequalities. And in this case, what we're going to do is we're just going to repeat this process over and over again, go through the same list of steps that we have for as many inequalities as we have. Now we're going to see something interesting that happens. So, for example, if I were to graph this inequality and, let's say, it just looks something like this, what we're going to see is that when we graph this inequality where our shading area is going to overlap with the shading area of the first graph. And what we're going to see here is that there's going to be this one region where all of the shadings will overlap, and this will be the solution to the system of inequalities. So the whole idea here is that to graph a system of inequalities, you're going to plot all the lines, all the curves, and shade the regions making points or, containing points that make all of the inequalities true. And to do this, we're going to use different colors and different styles of shading. You can do this however you want, basically shading each curve first. And then later on, we'll find the overlap. So let me go ahead and just break this down for you. We'll follow this list of steps here. Let's take a look at our first example. We've got \( y \leq -x + 4 \). So let's go through our steps. We're going to graph the solid or dashed curve. This is going to be a solid line because we have a solid symbol underneath the equation. And we're just going to replace it with an equal sign. So what does \( y = -x + 4 \) look like? It looks like it goes through the point, the y intercept of \( 0, 4 \), and it has a slope of negative 1. So this is going to look something like this. It's going to be a solid line, so it looks like that. Alright? So that's our equation or that's our graph. And then to test the point, we can just pick any point that's underneath this graph or really anywhere. So I'm just going to pick this point over here. This is going to be a point \( 0, 2 \). So if I test out this point \( 0, 2 \), what happens? Well, this is saying that \( 2 \) is less than or equal to \( -0+4 \). So is this actually a true statement? The \( 0 \) will go away. So is \( 2 \) less than or equal to \( 4 \)? That is actually a true statement. So we also just could have used the shortcut that because of the sign here, where we're just going to graph everything that's underneath this line, and we that would have been perfectly fine. So this all of this area here, this whole thing satisfies, the red inequality, the red equation that we have here. Alright? Now, let's do the same exact thing for the blue equation. Right? So we did all these things. For the blue equation, we're going to graph this equation, \( y > 2x + 1 \). So, in this case, we're going to have is a y intercept of 1, and it's going to have a slope of 2. But this one's going to be a dash line because of the symbol. So in other words, it's going to look something like this. So this equation is going to look something like that. So that's going to be our line. And now let's go ahead and graph the, inequality. Now what we could do or sorry, shade the area. Now in order to test the points, you actually don't have to pick a different point. You could pick the exact same point that we did over here. So what about \( 0, 2 \)? Does this satisfy this inequality? What this is saying is that \( 2 \) is greater than \( 0 + 1 \). Is that a true statement? Well, \( 2 \), in fact, is greater than 1, so this is a true statement. And therefore, we've tested a point, and we're going to shade that inequality. So in other words, for the blue equation, it's actually going to be everything that includes this point as well. So what would we see here? We're going to see that when we shade this equation, we're going to see some yellow, some blue, and some green. You also could have seen this use different sorts of styles of hatching, of, you know, crossing out. So I've seen some people do something like this, and then they'll use markings like this for the blue one. And you'll just find the ones the ones where they overlap. So there's a bunch of different ways to do it. But in this case here, the point is that in some cases or sorry, for this region, these are going to be the points
Table of contents
- 0. Fundamental Concepts of Algebra3h 29m
- 1. Equations and Inequalities3h 27m
- 2. Graphs1h 43m
- 3. Functions & Graphs2h 17m
- 4. Polynomial Functions1h 54m
- 5. Rational Functions1h 23m
- 6. Exponential and Logarithmic Functions2h 28m
- 7. Measuring Angles39m
- 8. Trigonometric Functions on Right Triangles2h 5m
- 9. Unit Circle1h 19m
- 10. Graphing Trigonometric Functions1h 19m
- 11. Inverse Trigonometric Functions and Basic Trig Equations1h 41m
- 12. Trigonometric Identities 2h 34m
- 13. Non-Right Triangles1h 38m
- 14. Vectors2h 25m
- 15. Polar Equations2h 5m
- 16. Parametric Equations1h 6m
- 17. Graphing Complex Numbers1h 7m
- 18. Systems of Equations and Matrices1h 6m
- 19. Conic Sections2h 36m
- 20. Sequences, Series & Induction1h 15m
- 21. Combinatorics and Probability1h 45m
- 22. Limits & Continuity1h 49m
- 23. Intro to Derivatives & Area Under the Curve2h 9m
18. Systems of Equations and Matrices
Graphing Systems of Inequalities
Video duration:
6mPlay a video:
Related Videos
Related Practice