Here are the essential concepts you must grasp in order to answer the question correctly.
Simple Harmonic Motion (SHM)
Simple Harmonic Motion is a type of periodic motion where an object oscillates around an equilibrium position. The motion is characterized by a restoring force proportional to the displacement from the equilibrium, leading to sinusoidal position, velocity, and acceleration graphs. In SHM, the position of the particle can be described by a sine or cosine function, which reflects the repetitive nature of the motion.
Recommended video:
Simple Harmonic Motion of Pendulums
Phase Constant
The phase constant is a parameter in the mathematical description of oscillatory motion that determines the initial position of the oscillating object at time t=0. It shifts the sine or cosine function along the time axis, allowing for different starting points in the oscillation cycle. The phase constant is crucial for accurately describing the motion of the particle in relation to its equilibrium position.
Recommended video:
Phase Constant of a Wave Function
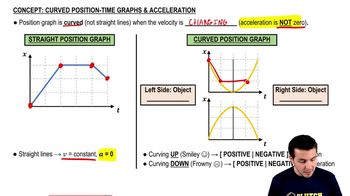
Position vs. Time Graph
A position versus time graph visually represents the displacement of an object over time. In the context of SHM, this graph typically shows a sinusoidal wave, indicating how the position of the particle varies periodically. The peaks and troughs of the graph correspond to the maximum and minimum displacements, while the x-axis represents time, allowing for the analysis of the motion's frequency and amplitude.
Recommended video:
Curved Position-Time Graphs & Acceleration


 07:52
07:52