Here are the essential concepts you must grasp in order to answer the question correctly.
Simple Harmonic Motion (SHM)
Simple Harmonic Motion is a type of periodic motion where an object oscillates around an equilibrium position. The motion is characterized by a restoring force proportional to the displacement from the equilibrium, leading to a sinusoidal position versus time graph. In SHM, the maximum displacement from the equilibrium is called amplitude, and the motion is defined by parameters such as frequency and period.
Recommended video:
Simple Harmonic Motion of Pendulums
Maximum Velocity (vₘₐₓ)
The maximum velocity (vₘₐₓ) in simple harmonic motion occurs as the object passes through the equilibrium position. It can be calculated using the formula vₘₐₓ = ωA, where ω is the angular frequency and A is the amplitude of the motion. This velocity is crucial for understanding the dynamics of the oscillating system and indicates the highest speed the particle achieves during its motion.
Recommended video:
Position vs. Time Graph
A position versus time graph visually represents the motion of an object over time. In the context of simple harmonic motion, this graph typically shows a sinusoidal pattern, indicating periodic oscillations. The peaks of the graph correspond to the maximum displacement (amplitude), while the zero crossings indicate the moments when the object passes through the equilibrium position, where its velocity is at its maximum.
Recommended video:
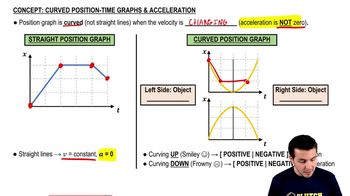
Curved Position-Time Graphs & Acceleration

 Verified step by step guidance
 This video solution was recommended by our tutors as helpful for the problem above.
 07:52
07:52