2. 1D Motion / Kinematics
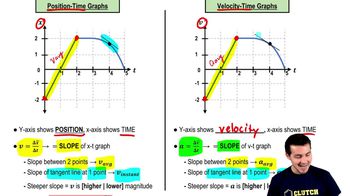
Velocity-Time Graphs & Acceleration
 05:59
05:59
Learn with other creators


Practice this topic
- Textbook Question
High-speed motion pictures ( frames/second) of a jumping, flea yielded the data used to plot the graph in Fig. E. (See 'The Flying Leap of the Flea' by M. Rothschild, Y. Schlein, K. Parker, C. Neville, and S. Sternberg in the November Scientific American.) This flea was about mm long and jumped at a nearly vertical takeoff angle. Use the graph to answer this question: Find the flea's acceleration at ms, ms, and ms.
1211views - Textbook Question
High-speed motion pictures ( frames/second) of a jumping, flea yielded the data used to plot the graph in Fig. E. (See 'The Flying Leap of the Flea' by M. Rothschild, Y. Schlein, K. Parker, C. Neville, and S. Sternberg in the November Scientific American.) This flea was about mm long and jumped at a nearly vertical takeoff angle. Use the graph to answer this question: Find the maximum height the flea reached in the first ms.
1473views - Textbook Question
High-speed motion pictures ( frames/second) of a jumping, flea yielded the data used to plot the graph in Fig. E. (See 'The Flying Leap of the Flea' by M. Rothschild, Y. Schlein, K. Parker, C. Neville, and S. Sternberg in the November Scientific American.) This flea was about mm long and jumped at a nearly vertical takeoff angle. Use the graph to answer this question: Is the acceleration of the flea ever zero? If so, when? Justify your answer.
1331views - Textbook Question
The table shows test data for the Bugatti Veyron Super Sport, the fastest street car made. The car is moving in a straight line (the -axis).
(a) Sketch a - graph of this car's velocity (in mi/h) as a function of time. Is its acceleration constant?
(b) Calculate the car's average acceleration (in m/s2) between (i) and s; (ii) s and s; (iii) s and s. Are these results consistent with your graph in part (a)? (Before you decide to buy this car, it might be helpful to know that only will be built, it runs out of gas in minutes at top speed, and it costs more than million!)
1441views - Multiple Choice
Given a velocity-time graph where the velocity at time is
m/s , what is the initial velocity of the object inm/s ?70views - Multiple Choice
Which of the following best explains the information needed to calculate and from a graph?
58views - Multiple Choice
Given a vs. graph that shows a straight line with a constant positive slope, which of the following vs. graphs correctly represents the motion?
88views - Multiple Choice
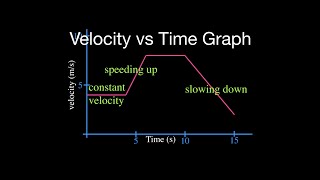
Which statement best describes a runner who is running at a constant according to a - graph?
87views