Table of contents
- 0. Basic Principles of Economics1h 5m
- Introduction to Economics3m
- People Are Rational2m
- People Respond to Incentives1m
- Scarcity and Choice2m
- Marginal Analysis9m
- Allocative Efficiency, Productive Efficiency, and Equality7m
- Positive and Normative Analysis7m
- Microeconomics vs. Macroeconomics2m
- Factors of Production5m
- Circular Flow Diagram5m
- Graphing Review10m
- Percentage and Decimal Review4m
- Fractions Review2m
- 1. Reading and Understanding Graphs59m
- 2. Introductory Economic Models1h 10m
- 3. The Market Forces of Supply and Demand2h 26m
- Competitive Markets10m
- The Demand Curve13m
- Shifts in the Demand Curve24m
- Movement Along a Demand Curve5m
- The Supply Curve9m
- Shifts in the Supply Curve22m
- Movement Along a Supply Curve3m
- Market Equilibrium8m
- Using the Supply and Demand Curves to Find Equilibrium3m
- Effects of Surplus3m
- Effects of Shortage2m
- Supply and Demand: Quantitative Analysis40m
- 4. Elasticity2h 26m
- Percentage Change and Price Elasticity of Demand19m
- Elasticity and the Midpoint Method20m
- Price Elasticity of Demand on a Graph11m
- Determinants of Price Elasticity of Demand6m
- Total Revenue Test13m
- Total Revenue Along a Linear Demand Curve14m
- Income Elasticity of Demand23m
- Cross-Price Elasticity of Demand11m
- Price Elasticity of Supply12m
- Price Elasticity of Supply on a Graph3m
- Elasticity Summary9m
- 5. Consumer and Producer Surplus; Price Ceilings and Floors3h 45m
- Consumer Surplus and Willingness to Pay38m
- Producer Surplus and Willingness to Sell26m
- Economic Surplus and Efficiency18m
- Quantitative Analysis of Consumer and Producer Surplus at Equilibrium28m
- Price Ceilings, Price Floors, and Black Markets38m
- Quantitative Analysis of Price Ceilings and Price Floors: Finding Points20m
- Quantitative Analysis of Price Ceilings and Price Floors: Finding Areas54m
- 6. Introduction to Taxes and Subsidies1h 46m
- 7. Externalities1h 12m
- 8. The Types of Goods1h 13m
- 9. International Trade1h 16m
- 10. The Costs of Production2h 35m
- 11. Perfect Competition2h 23m
- Introduction to the Four Market Models2m
- Characteristics of Perfect Competition6m
- Revenue in Perfect Competition14m
- Perfect Competition Profit on the Graph20m
- Short Run Shutdown Decision33m
- Long Run Entry and Exit Decision18m
- Individual Supply Curve in the Short Run and Long Run6m
- Market Supply Curve in the Short Run and Long Run9m
- Long Run Equilibrium12m
- Perfect Competition and Efficiency15m
- Four Market Model Summary: Perfect Competition5m
- 12. Monopoly2h 13m
- Characteristics of Monopoly21m
- Monopoly Revenue12m
- Monopoly Profit on the Graph16m
- Monopoly Efficiency and Deadweight Loss20m
- Price Discrimination22m
- Antitrust Laws and Government Regulation of Monopolies11m
- Mergers and the Herfindahl-Hirschman Index (HHI)17m
- Four Firm Concentration Ratio6m
- Four Market Model Summary: Monopoly4m
- 13. Monopolistic Competition1h 9m
- 14. Oligopoly1h 26m
- 15. Markets for the Factors of Production1h 33m
- The Production Function and Marginal Revenue Product16m
- Demand for Labor in Perfect Competition7m
- Shifts in Labor Demand13m
- Supply of Labor in Perfect Competition7m
- Shifts in Labor Supply5m
- Differences in Wages6m
- Discrimination6m
- Other Factors of Production: Land and Capital5m
- Unions6m
- Monopsony11m
- Bilateral Monopoly5m
- 16. Income Inequality and Poverty35m
- 17. Asymmetric Information, Voting, and Public Choice39m
- 18. Consumer Choice and Behavioral Economics1h 16m
16. Income Inequality and Poverty
Lorenz Curve and Gini Coefficient
Struggling with Microeconomics?
Join thousands of students who trust us to help them ace their exams!Watch the first videoMultiple Choice
Which of the following would represent the Lorenz curve of an nation where everyone earned equal income?
A
The Lorenz curve would have a negative slope
B
The Lorenz curve would be U-shaped.
C
The Lorenz curve would be a straight line with a slope of 1.
D
The Lorenz curve would not exist.

1
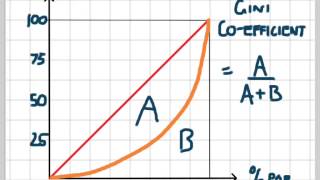
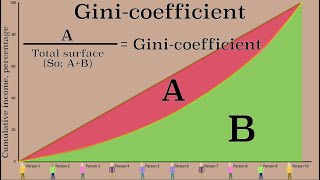
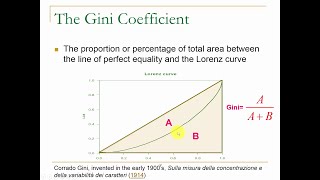
Understand the concept of the Lorenz curve: It is a graphical representation of income or wealth distribution within a nation, showing the proportion of total income earned by cumulative percentages of the population.
Recognize that a perfectly equal income distribution means that each percentage of the population earns the same percentage of total income.
Visualize the Lorenz curve for perfect equality: In this scenario, the curve would be a straight line from the origin (0,0) to the point (1,1) on a graph where the x-axis represents the cumulative percentage of the population and the y-axis represents the cumulative percentage of income.
Identify the slope of the line: For perfect equality, the line has a slope of 1, indicating that each additional percentage of the population accounts for an equal percentage of total income.
Conclude that the Lorenz curve for a nation where everyone earns equal income is a straight line with a slope of 1, representing perfect equality.
Watch next
Master Lorenz Curve and the Gini Coefficient with a bite sized video explanation from Brian Krogol
Start learningRelated Videos
Related Practice