Here are the essential concepts you must grasp in order to answer the question correctly.
Periodic Trends
Periodic trends refer to the predictable patterns observed in the properties of elements as one moves across or down the periodic table. These trends include variations in atomic radius, ionization energy, electronegativity, and electron affinity, which are influenced by the arrangement of electrons and the effective nuclear charge experienced by those electrons.
Recommended video:
Periodic Trend: Metallic Character
Electronegativity
Electronegativity is a measure of an atom's ability to attract and hold onto electrons when forming chemical bonds. It typically increases across a period from left to right due to increasing nuclear charge and decreases down a group as the distance between the nucleus and valence electrons increases, leading to a weaker attraction.
Recommended video:
Dipole Moment (Simplified) Concept 1
Correlation with the Periodic Table
The correlation of peaks and valleys in trends like electronegativity with the periodic table reflects the underlying electronic structure of elements. For instance, elements in the same group exhibit similar electronegativity values, while those in the same period show a general increase in electronegativity, highlighting the influence of atomic structure on chemical behavior.
Recommended video:
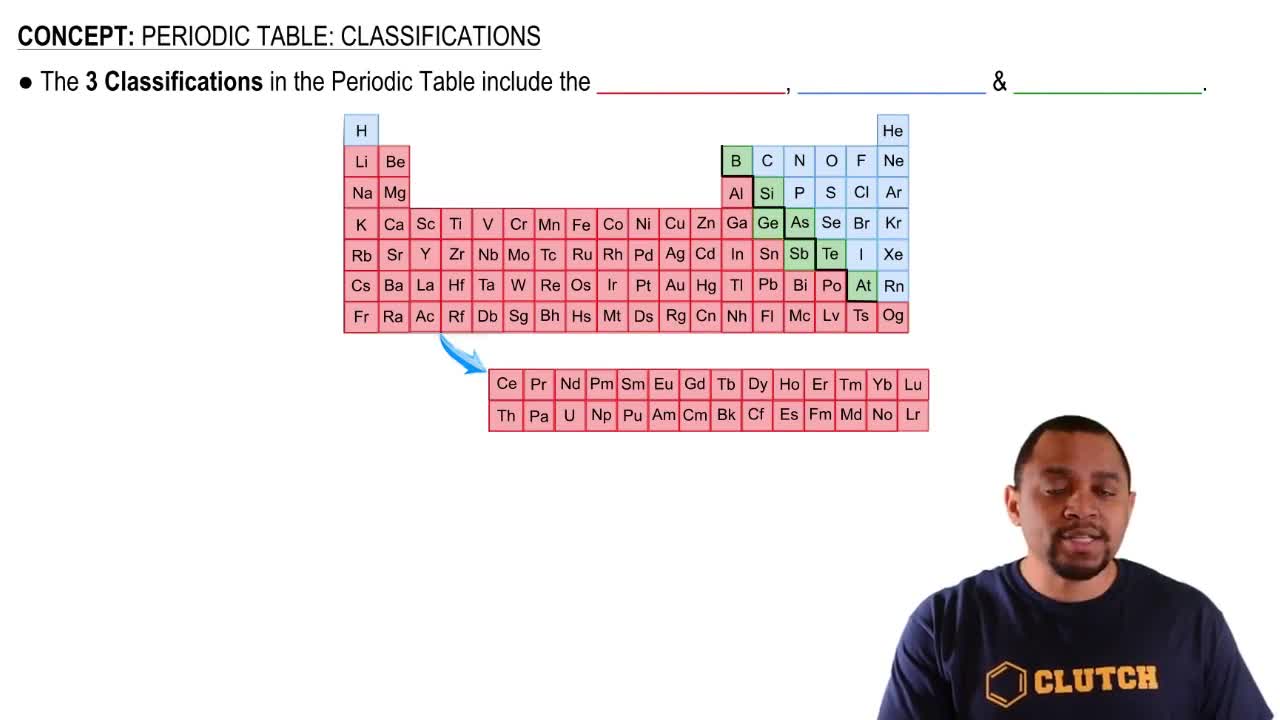
Periodic Table: Classifications

 Verified step by step guidance
 This video solution was recommended by our tutors as helpful for the problem above.
 00:38
00:38