Open Question
The rate constant of a reaction at 32 °C is 0.055 s⁻¹. If the frequency factor is 1.2 × 10¹³ s⁻¹, what is the activation barrier?

 This video solution was recommended by our tutors as helpful for the problem above.
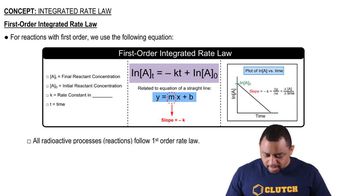
 02:29
02:29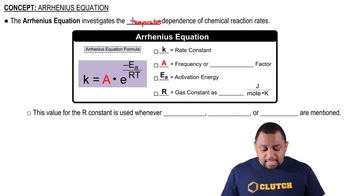 01:20
01:20 02:02
02:02The rate constant (k) for a reaction was measured as a function of temperature. A plot of ln k versus 1/T (in K) is linear and has a slope of -7445 K. Calculate the activation energy for the reaction.
The tabulated data show the rate constant of a reaction measured at several different temperatures. Use an Arrhenius plot to determine the activation barrier and frequency factor for the reaction.
Temperature (K) Rate Constant (1 , s)
300 0.0134
310 0.0407
320 0.114
330 0.303
340 0.757
The tabulated data show the rate constant of a reaction measured at several different temperatures. Use an Arrhenius plot to determine the activation barrier and frequency factor for the reaction.
Temperature (K) Rate Constant (1 , s)
310 0.00434
320 0.0140
330 0.0421
340 0.118
350 0.316