Here are the essential concepts you must grasp in order to answer the question correctly.
Phase Diagram
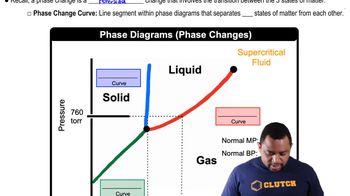
A phase diagram is a graphical representation that shows the states of a substance (solid, liquid, gas) at various temperatures and pressures. It helps visualize the conditions under which a substance exists in different phases and the transitions between these phases, such as melting, boiling, and sublimation.
Recommended video:
Phase Changes in Diagrams
State Changes
State changes refer to the transitions between different phases of matter, which occur due to changes in temperature and pressure. For CO2, these changes include sublimation (solid to gas), melting (solid to liquid), and vaporization (liquid to gas). Understanding these transitions is crucial for predicting the behavior of CO2 under varying conditions.
Recommended video:
Critical Point
The critical point is the temperature and pressure at which the distinction between liquid and gas phases disappears. Beyond this point, the substance becomes a supercritical fluid, exhibiting properties of both gas and liquid. For CO2, knowing the critical point is essential for understanding its behavior at high temperatures and pressures.
Recommended video:

 03:22
03:22