Ch.5 - Periodicity & Electronic Structure of Atoms
Chapter 5, Problem 56

Spectroscopy is a technique that uses the interaction of radiant energy with matter to identify or quantify a substance in a sample. A deuterium lamp is often used a light source in the ultraviolet region of the spectrum and the emission spectrum is shown. Is this a continuous or line emission spectrum? Graph showing absorbance vs wavelength (200-800 nm) for spectroscopy analysis.

Verified step by step guidance
1
Step 1: Understand the concept of emission spectra. Emission spectra can be either continuous or line spectra. A continuous spectrum shows a seamless range of wavelengths, while a line spectrum shows distinct lines at specific wavelengths.
Step 2: Observe the provided graph. The graph shows absorbance versus wavelength, ranging from 200 nm to 800 nm.
Step 3: Analyze the graph. Notice that the graph displays peaks at certain wavelengths rather than a smooth, continuous distribution of absorbance values.
Step 4: Identify the type of spectrum. Since the graph shows distinct peaks at specific wavelengths, it indicates the presence of a line emission spectrum rather than a continuous spectrum.
Step 5: Conclude that the emission spectrum shown in the graph is a line emission spectrum, as it consists of discrete peaks corresponding to specific wavelengths.

Verified Solution

Video duration:
2m
This video solution was recommended by our tutors as helpful for the problem above.
Was this helpful?

Key Concepts

Here are the essential concepts you must grasp in order to answer the question correctly.

Spectroscopy

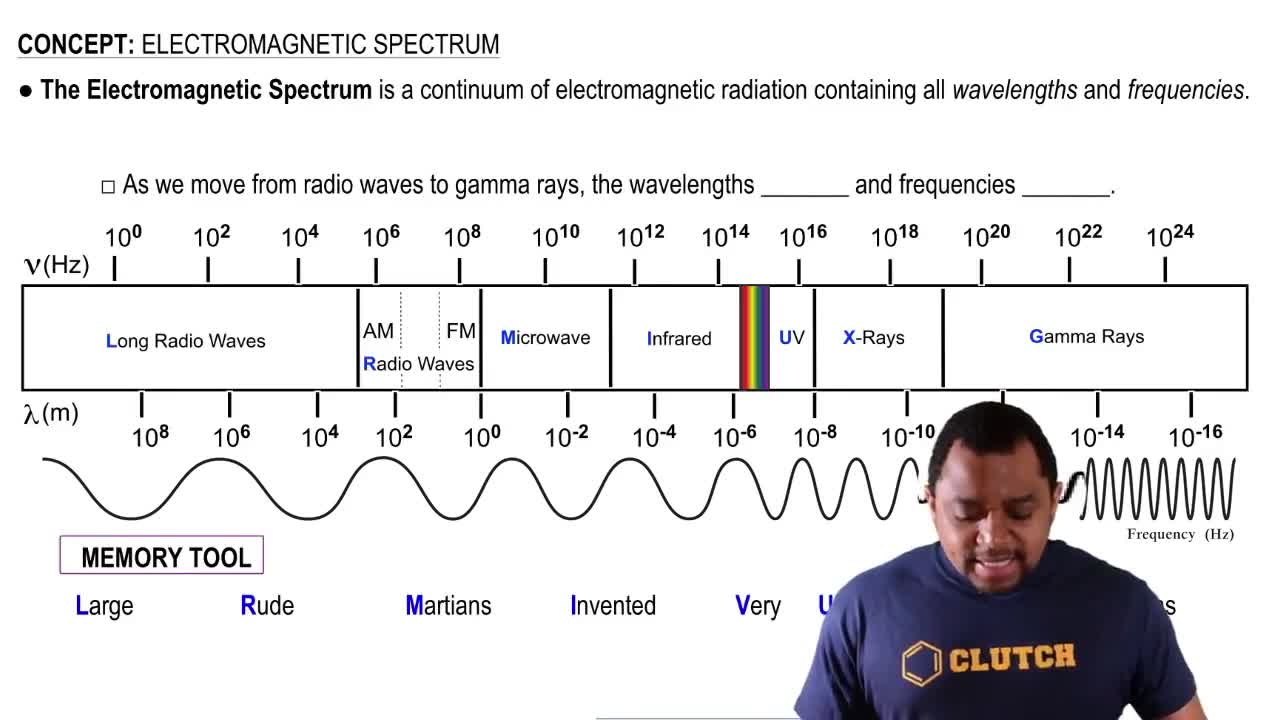
Spectroscopy is the study of how matter interacts with electromagnetic radiation. It involves measuring the absorption, emission, or scattering of light by substances to identify their composition and concentration. Different types of spectroscopy, such as UV-Vis, IR, and NMR, utilize specific regions of the electromagnetic spectrum to provide insights into molecular structure and behavior.
Recommended video:
Guided course
05:47
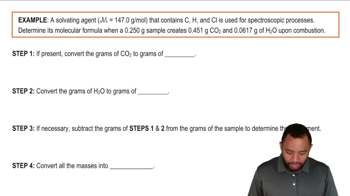
Molecular Formula via Combustion Example

Continuous vs. Line Emission Spectrum

A continuous emission spectrum displays a seamless range of wavelengths, indicating that all colors of light are emitted. In contrast, a line emission spectrum consists of distinct lines at specific wavelengths, representing the emission of light from atoms or molecules transitioning between energy levels. The type of spectrum observed can provide information about the electronic structure of the substance being analyzed.
Recommended video:
Guided course
01:51
Emission Spectra

Absorbance Spectrum

An absorbance spectrum is a graphical representation of how much light a substance absorbs at different wavelengths. Peaks in the absorbance spectrum indicate wavelengths where the substance absorbs light strongly, which corresponds to electronic transitions. Analyzing the absorbance spectrum helps in identifying the presence of specific compounds and understanding their concentration in a sample.
Recommended video:
Guided course
02:53
Electromagnetic Spectrum
Related Practice
Textbook Question
The work function of calcium metal is kJ/mol, which corresponds to light with a wavelength of 432 nm. Which of the following will cause the largest number of electrons to be ejected from cesium? (a) High-amplitude wave with a wavelength of 400 nm (b) Low-amplitude wave with a wavelength of 400 nm (c) High-amplitude wave with a wavelength of 450 nm (d) Low-amplitude wave with a wavelength of 450 nm
1171
views
Textbook Question
The work function of silver metal is 436 kJ/mol. What frequency of light is needed to eject electrons from a sample of silver?
1066
views
Textbook Question
Cesium metal is frequently used in photoelectric cells because the amount of energy necessary to eject electrons from a cesium surface is relatively small—only 206.5 kJ/mol. What wavelength of light in nanometers does this correspond to?
2054
views
Textbook Question
Sodium-vapor lamps are a common source of lighting. The emission spectrum from this type of lamp is shown. Is this a continuous or line emission spectrum?

626
views
Textbook Question
According to the equation for the Balmer line spectrum of hydrogen, a value of n = 3 gives a red spectral line at 656.3 nm, a value of n = 4 gives a green line at 486.1 nm, and a value of n = 5 gives a blue line at 434.0 nm. Calculate the energy in kilojoules per mole of the radiation corresponding to each of these spectral lines.
1658
views
1
rank
Textbook Question
Calculate the wavelength and energy in kilojoules necessary to completely remove an electron from the second shell (m = 2) of a hydrogen atom (R∞ = 1.097 * 10-2 nm-1).
1122
views