Here are the essential concepts you must grasp in order to answer the question correctly.
Standard Molar Entropy
Standard molar entropy is a measure of the amount of disorder or randomness in a system at a standard state, typically defined at 1 bar and a specified temperature. It reflects the number of accessible microstates for a given amount of substance. For methane, the standard molar entropy at 25 °C is 186.2 J/(K·mol), indicating its degree of disorder at that temperature.
Recommended video:
Phase Changes and Temperature
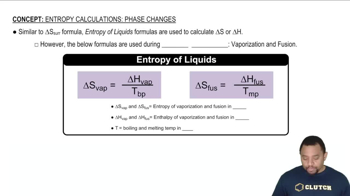
Phase changes, such as melting and boiling, significantly affect the entropy of a substance. For methane, the melting point (-182 °C) and boiling point (-164 °C) indicate temperature ranges where the substance transitions between solid, liquid, and gas phases. These transitions are associated with changes in entropy, as the disorder increases when moving from solid to liquid to gas.
Recommended video:
Qualitative Plotting
Qualitative plotting involves creating a visual representation of data without precise numerical values, focusing instead on trends and relationships. In this context, plotting standard molar entropy against temperature for methane requires understanding how entropy changes with temperature, particularly around phase transitions, to illustrate the general behavior of entropy from 0 K to 298 K.
Recommended video:
 McMurry 8th Edition
 Ch.18 - Thermodynamics: Entropy, Free Energy & Equilibrium
 Problem 60
 Verified step by step guidance


