Ch.17 - Applications of Aqueous Equilibria
Chapter 17, Problem 39b

The following pictures represent initial concentrations in solutions that contain a weak acid HA (pKa = 6.0) and its sodium salt NaA. (Na+ ions and solvent water molecules have been omitted for clarity.)
Illustration of weak acid HA and its salt NaA in solution, showing equilibrium after adding H3O+ ions.
. (b) Draw a picture that represents the equilibrium state of solution (1) after the addition of two H3O+ ions.

Verified step by step guidance
1
Identify the components in the solution: HA (weak acid) and A⁻ (conjugate base).
Recognize that adding H₃O⁺ ions will shift the equilibrium towards the formation of more HA, as per Le Chatelier's principle.
In the initial state (image 1), count the number of HA and A⁻ particles to understand the starting concentrations.
After adding two H₃O⁺ ions, expect two A⁻ ions to react with H₃O⁺ to form two additional HA molecules.
Draw the new equilibrium state by increasing the number of HA molecules by two and decreasing the number of A⁻ ions by two.

Verified Solution

Video duration:
1m
This video solution was recommended by our tutors as helpful for the problem above.
Was this helpful?

Key Concepts

Here are the essential concepts you must grasp in order to answer the question correctly.

Weak Acids and Their Equilibrium

Weak acids, like HA, do not fully dissociate in solution, establishing an equilibrium between the undissociated acid and its ions. The equilibrium constant, Ka, quantifies this balance, and the pKa value indicates the strength of the acid. A lower pKa means a stronger acid, while a higher pKa indicates a weaker acid.
Recommended video:
Guided course
00:44
ICE Charts of Weak Acids

H3O+ Ion Addition

Adding H3O+ ions to a solution containing a weak acid shifts the equilibrium according to Le Chatelier's principle. This principle states that if a system at equilibrium is disturbed, it will adjust to counteract the disturbance. In this case, the addition of H3O+ will favor the formation of more undissociated acid (HA) from its ions (A-).
Recommended video:
Guided course
02:55
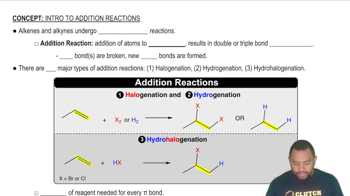
Addition Reactions

Equilibrium Representation in Diagrams

Diagrams representing chemical equilibria visually depict the relative concentrations of reactants and products. In the context of weak acids, these diagrams can illustrate the distribution of HA and A- before and after the addition of H3O+ ions, helping to conceptualize how the equilibrium shifts and the resulting changes in concentration.
Recommended video:
Guided course
01:57
Energy Diagrams
Related Practice
Textbook Question
Consider the following table of standard reduction potentials:

(b) Which substances can be oxidized by B2+? Which can be reduced by D?
485
views
Textbook Question

The strong acid HA is mixed with an equal molar amount of aqueous NaOH. Which of the following pictures represents the equilibrium state of the solution? (Na+ ions and solvent water molecules have been omitted for clarity.)

(A) (B) (C) (D)

689
views
Textbook Question
The following pictures represent initial concentrations in solutions that contain a weak acid HA (pKa = 6.0) and its sodium salt NaA. (Na+ ions and solvent water molecules have been omitted for clarity.)

. (c) Draw a picture that represents the equilibrium state of solution (1) after the addition of two OH-ions.
404
views
Textbook Question

The following pictures represent solutions that contain one or more of the compounds H2A, NaHA, and Na2A, where H2A is a weak diprotic acid. (Na+ ions and solvent water molecules have been omitted for clarity.)

(a) Which of the solutions are buffer solutions?

392
views
Textbook Question

The following pictures represent solutions that contain one or more of the compounds H2A, NaHA, and Na2A, where H2A is a weak diprotic acid. (Na+ ions and solvent water molecules have been omitted for clarity.)

(b) Which solution has the greatest buffer capacity?

815
views
Textbook Question

The following plot shows two pH titration curves, each representing the titration of 50.0 mL of 0.100 M acid with 0.100 M NaOH:

. (a) Which of the two curves represents the titration of a strong acid? Which represents a weak acid?

800
views