Ch.17 - Applications of Aqueous Equilibria
Chapter 17, Problem 87

On the same graph, sketch pH titration curves for the titra-tion of (1) a strong acid with a strong base and (2) a weak acid with a strong base. How do the two curves differ with respect to the following? (a) The initial pH

Verified step by step guidance
1
insert step 1> Identify the acids and bases involved in each titration. For the strong acid-strong base titration, consider an example like HCl (strong acid) and NaOH (strong base). For the weak acid-strong base titration, consider an example like CH3COOH (acetic acid, weak acid) and NaOH (strong base).
insert step 2> Understand the initial pH of each solution before any base is added. For the strong acid, the initial pH is low because strong acids dissociate completely in water, resulting in a high concentration of H+ ions. For the weak acid, the initial pH is higher than that of the strong acid because weak acids only partially dissociate in water.
insert step 3> Sketch the pH titration curve for the strong acid with a strong base. Start with a low pH, and as the base is added, the pH will increase rapidly near the equivalence point, which is typically around pH 7 for strong acid-strong base titrations.
insert step 4> Sketch the pH titration curve for the weak acid with a strong base. Start with a higher initial pH compared to the strong acid. The curve will have a more gradual slope and the equivalence point will be above pH 7 due to the formation of a weak conjugate base.
insert step 5> Compare the initial pH of both titration curves. The strong acid-strong base titration starts at a lower pH compared to the weak acid-strong base titration, reflecting the complete dissociation of the strong acid versus the partial dissociation of the weak acid.

Verified Solution

Video duration:
7m
This video solution was recommended by our tutors as helpful for the problem above.
Was this helpful?

Key Concepts

Here are the essential concepts you must grasp in order to answer the question correctly.

Strong Acid vs. Weak Acid

A strong acid completely dissociates in solution, resulting in a high concentration of hydrogen ions (H+) and a low initial pH. In contrast, a weak acid only partially dissociates, leading to a higher initial pH due to the lower concentration of H+ ions. This fundamental difference affects the shape of the titration curve.
Recommended video:
Guided course
01:15
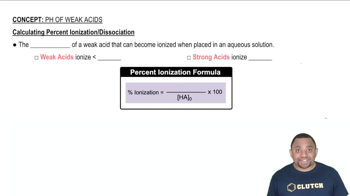
Calculating Percent Ionization of Weak Acids

Titration Curves

Titration curves graph the pH of a solution as a function of the volume of titrant added. For a strong acid-strong base titration, the curve shows a sharp increase in pH at the equivalence point, while a weak acid-strong base titration displays a more gradual slope and a buffer region before the equivalence point, reflecting the weak acid's resistance to pH changes.
Recommended video:
Guided course
02:16
Acid-Base Titration Curves

Equivalence Point

The equivalence point in a titration is reached when the amount of titrant added is stoichiometrically equivalent to the amount of substance in the solution. For strong acid-strong base titrations, this point typically occurs at pH 7, while for weak acid-strong base titrations, it occurs at a pH greater than 7 due to the formation of a weak conjugate base.
Recommended video:
Guided course
01:07
At the Equivalence Point
Related Practice
Textbook Question
Make a rough plot of pH versus milliliters of acid added for the titration of 50.0 mL of 1.0 M NaOH with 1.0 M HCl. Indicate the pH at the following points, and tell how many milliliters of acid are required to reach the equivalence point. (a) At the start of the titration (b) At the equivalence point (c) After the addition of a large excess of acid
724
views
Textbook Question
Consider the titration of 40.0 mL of 0.250 M HF with 0.200 M NaOH. How many milliliters of base are required to reach the equivalence point? Calculate the pH at each of the following points. (d) After the addition of 80.0 mL of base
732
views
1
rank
Open Question
Consider the titration of 25.0 mL of 0.200 M HCO2H with 0.250 M NaOH. How many milliliters of base are required to reach the equivalence point? Calculate the pH at each of the following points: (c) At the equivalence point, (d) After the addition of 25.0 mL of base.
Open Question
Consider the titration of 50.0 mL of 0.010 M HA (Ka = 1.0 x 10^-4) with 0.010 M NaOH. (a) Sketch the pH titration curve, and label the equivalence point. (b) How many milliliters of 0.010 M NaOH are required to reach the equivalence point? (c) Is the pH at the equivalence point greater than, equal to, or less than 7? (d) What is the pH exactly halfway to the equivalence point?
Textbook Question
The equivalence point was reached in titrations of three unknown acids at pH 9.16 (acid A), 8.88 (acid B), and 8.19 (acid C). (a) Which is the strongest acid? (b) Which is the weakest acid?
378
views
Textbook Question

What is the pH at the equivalence point for the titration of 0.10 M solutions of the following acids and bases, and which of the indicators in Figure 17.5 would be suitable for each titration? (a) HNO2 and NaOH

408
views