Ch.11 - Liquids & Phase Changes
Chapter 11, Problem 6

Consider a compound that has a melting point at 65 °C and a boiling point at 175 °C. Which of the following images represents a heating curve for the compound from 40 °C to 200 °C? (LO 11.5)

Verified step by step guidance
1
Step 1: Understand what a heating curve is. A heating curve is a plot of temperature versus time. It shows how the temperature of a substance changes as heat is added at a constant rate. The flat sections of the curve represent the phase changes, where the substance is transitioning from one state of matter to another (solid to liquid or liquid to gas). During these phase changes, the temperature remains constant.
Step 2: Identify the phase changes in the problem. The compound has a melting point at 65 °C and a boiling point at 175 °C. This means that the compound transitions from solid to liquid at 65 °C and from liquid to gas at 175 °C.
Step 3: Visualize the heating curve. The heating curve should start at a temperature below 65 °C (since the initial temperature is 40 °C), then rise until it reaches 65 °C, where it should remain flat as the compound melts. After all the solid has melted, the temperature should start to rise again until it reaches 175 °C, where it should remain flat as the compound boils. After all the liquid has boiled, the temperature should start to rise again until it reaches 200 °C.
Step 4: Compare the heating curve you visualized with the images provided. The correct image should match the description from step 3.
Step 5: Remember that the slope of the curve represents the rate of temperature change. The steeper the slope, the faster the temperature is changing. During phase changes (melting and boiling), the slope should be zero because the temperature is not changing.

Verified Solution

Video duration:
1m
This video solution was recommended by our tutors as helpful for the problem above.
Was this helpful?

Key Concepts

Here are the essential concepts you must grasp in order to answer the question correctly.

Heating Curve

A heating curve is a graphical representation that shows the change in temperature of a substance as it is heated over time. It illustrates the phases of matter (solid, liquid, gas) and the energy changes associated with phase transitions, such as melting and boiling. The curve typically features flat sections where phase changes occur, indicating that temperature remains constant while heat is added.
Recommended video:
Guided course
01:05
Calculations with Heating and Cooling Curves

Phase Changes

Phase changes refer to the transitions between solid, liquid, and gas states of matter, which occur at specific temperatures and pressures. For the compound in question, melting occurs at 65 °C, transitioning from solid to liquid, while boiling occurs at 175 °C, transitioning from liquid to gas. Understanding these phase changes is crucial for interpreting the heating curve and identifying the correct representation.
Recommended video:
Guided course
01:46
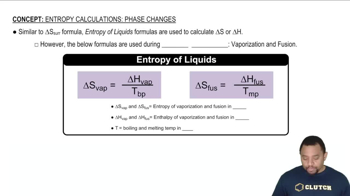
Entropy in Phase Changes

Melting and Boiling Points

The melting point is the temperature at which a solid becomes a liquid, while the boiling point is the temperature at which a liquid becomes a gas. These points are characteristic of a substance and are influenced by intermolecular forces. In this case, the compound's melting point at 65 °C and boiling point at 175 °C are essential for determining the segments of the heating curve that correspond to solid, liquid, and gas phases.
Recommended video:
Guided course
04:29
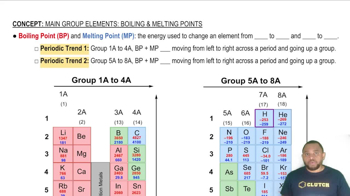
Boiling Point and Melting Point
Related Practice
Textbook Question
Three identical tubes are filled with different liquids; water, ethylene glycol, and olive oil. A small steel sphere was dropped into the tube, and the time it took to fall to the bottom was recorded. Which property of liquids is responsible for the differences in time for the sphere to fall through the liquid? (LO 11.1) (a) Surface tension (b) Boiling point (c) Viscosity (d) Vapor pressure
430
views
Textbook Question
Which organic compound has the lowest viscosity? (LO 11.2)
701
views
Textbook Question
Which molecule has polar bonds but is nonpolar? (LO 8.6) (a) SF6 (b) SF2 (c) F2 (d) NF3
834
views
Textbook Question
What types of intermolecular forces exist in a sample of acetone? (LO 8.8)

(a) Dispersion forces (b) Dispersion forces and dipole–dipole forces (c) Dipole–dipole forces (d) Dispersion forces, dipole–dipole forces, and hydrogen bonding
1237
views
Textbook Question
Arrange the following molecules from lowest to highest boiling point. (LO 8.9) (I)

(II)

(III)

(IV)

(a) I 6 II 6 III 6 IV (b) II 6 III 6 I 6 IV (c) IV 6 II 6 III 6 I (d) IV 6 I 6 II 6 III
697
views