Ch.14 - Chemical Kinetics
Chapter 14, Problem 10a

The accompanying graph shows plots of ln k versus 1>T for two different reactions. The plots have been extrapolated to the y-intercepts. Which reaction (red or blue) has (a) the larger value for Ea,
Graph showing ln k vs 1/T for two reactions, indicating their activation energies.

Verified step by step guidance
1
Identify the Arrhenius equation in its linear form: \( \ln k = -\frac{E_a}{R} \cdot \frac{1}{T} + \ln A \).
Recognize that the slope of the line in the plot of \( \ln k \) versus \( \frac{1}{T} \) is equal to \( -\frac{E_a}{R} \).
Compare the slopes of the two lines (Reaction 1 and Reaction 2) on the graph. The steeper the slope, the larger the magnitude of \( -\frac{E_a}{R} \), and thus the larger the activation energy \( E_a \).
Observe that Reaction 2 has a steeper slope compared to Reaction 1.
Conclude that Reaction 2 has the larger activation energy \( E_a \) compared to Reaction 1.

Verified Solution

Video duration:
2m
This video solution was recommended by our tutors as helpful for the problem above.
Was this helpful?

Key Concepts

Here are the essential concepts you must grasp in order to answer the question correctly.

Arrhenius Equation

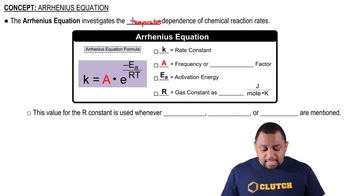
The Arrhenius equation describes the temperature dependence of reaction rates, expressed as k = A * e^(-Ea/RT), where k is the rate constant, A is the pre-exponential factor, Ea is the activation energy, R is the gas constant, and T is the temperature in Kelvin. This equation shows that as temperature increases, the rate constant k increases, indicating a faster reaction.
Recommended video:
Guided course
01:20
Arrhenius Equation

Activation Energy (Ea)
Activation energy (Ea) is the minimum energy required for a chemical reaction to occur. It represents the energy barrier that reactants must overcome to form products. In the context of the Arrhenius equation, a higher Ea results in a steeper slope in the ln k vs. 1/T plot, indicating that the reaction is less sensitive to temperature changes.
Recommended video:
Guided course
02:02
Activity Series Chart

Slope of the ln k vs. 1/T Plot

In a plot of ln k versus 1/T, the slope is equal to -Ea/R, where R is the gas constant. A steeper slope indicates a larger activation energy, meaning that the reaction requires more energy to proceed. By comparing the slopes of the two reactions in the graph, one can determine which reaction has a higher activation energy.
Recommended video:
Guided course
02:29
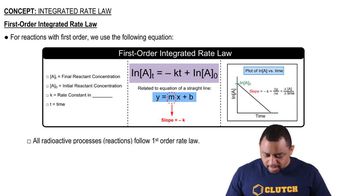
First-Order Reactions
Related Practice
Textbook Question

The following diagrams represent mixtures of NO(g) and O2(𝑔). These two substances react as follows:

2 NO(𝑔)+O2(𝑔)⟶2 NO2(𝑔)

It has been determined experimentally that the rate is second order in NO and first order in O2. Based on this fact, which of the following mixtures will have the fastest initial rate? [Section 14.2]

1
views
Textbook Question

Given the following diagrams at 𝑡=0 min and 𝑡=30 min, b. After four half-life periods for a first-order reaction, what fraction of reactant remains? [Section 14.3]

Textbook Question

Which of the following linear plots do you expect for a reaction A⟶products if the kinetics are a. zero order, [Section 14.3]

Textbook Question

The accompanying graph shows plots of ln k versus 1/𝑇 for two different reactions. The plots have been extrapolated to the y-intercepts. Which reaction (red or blue) has b. the larger value for the frequency factor, A? [Section 14.4]

Textbook Question

The following graph shows two different reaction pathways for the same overall reaction at the same temperature. Is each of the following statements true or false? (b) For both paths, the rate of the reverse reaction is slower than the rate of the forward reaction.

1156
views
Textbook Question

Consider the diagram that follows, which represents two steps in an overall reaction. The red spheres are oxygen, the blue ones are nitrogen, and the green ones are fluorine. d. Write the rate law for the overall reaction if the first step is the slow, rate-determining step. [Section 14.5]