Ch.4 - Reactions in Aqueous Solution

Chapter 4, Problem 11

Which data set, of the two graphed here, would you expect to observe from a titration like that shown in Figure 4.18?

Verified Solution
Video duration:
3m
This video solution was recommended by our tutors as helpful for the problem above.
286
views
Was this helpful?

Video transcript

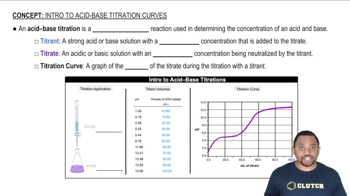
welcome back. Everyone in this example, we need to determine which of the below curves shown below is closer to the actual data observed in a titillation of an acid using a strong base and a phenolphthalein indicator. So we want to recall that in a titillation, we are using a strong base to neutralize an acid. And we should recall that the phenolphthalein indicator is going to, We recall it changes color when our acid is neutralized, meaning our titillation is complete. And we should recall that in our labs. This is a very instantaneous change and that's why it's helpful for us to have this phenolphthalein indicator because we will see our solutions change a very very pale pink color if we've appropriately neutralized our asset. So looking at our first two choices in our first diagram here, we can see that we have a gradual increase of ph as our volume of base is added to the acid and we would also observe that same trend here. For the second diagram given where we have a gradual increase in ph as our volume of bases added. Looking at our 3rd Diagram, given what we can see is that we have a pretty consistent ph of our acid where we all of a sudden have a Hike increase in an upward direction where we have a much larger value in Ph for our acid being at 12. And so we can say that we can assume that our acid is neutralized at this point here. And as we recall our phenolphthalein indicator is indicating an instantaneous change once articulation is complete. And because we can see that our first two diagrams given do not give us an instantaneous change, but rather a gradual change in ph We see that in diagram one and we also see that in diagram two, we would rule out these as answer choices. And so what that means is that the only correct diagram as the prompt asks us, which shows an actual depiction of the titillation is going to be our final answer here. So this would show us the sort of data that we would actually observe if we were in lab doing a tight rations on an acid where we have a instantaneous change indicated by our fennel pollen. That articulation has been complete and our acid is neutralized. And so what's highlighted in yellow is our final answer. So I hope that everything that I explained was clear. If you have any questions, please leave them down below. So this will correspond to choice. See in our multiple choice and I will see everyone in the next practice video