Textbook Question
Given the following diagrams at t = 0 min and t = 30 min
After four half-life periods for a first-order reaction, what fraction of reactant remains? [Section 14.4]
995
views
1
rank
1
comments

 Verified step by step guidance
 This video solution was recommended by our tutors as helpful for the problem above.
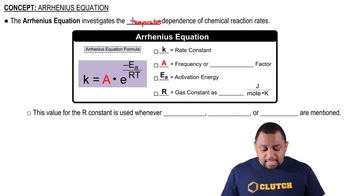
 01:20
01:20 02:02
02:02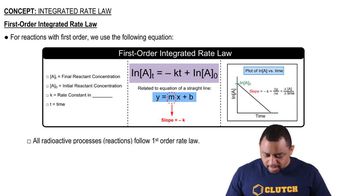 02:29
02:29Given the following diagrams at t = 0 min and t = 30 min
After four half-life periods for a first-order reaction, what fraction of reactant remains? [Section 14.4]
Which of the following linear plots do you expect for a reaction A¡products if the kinetics are (a) zero order, [Section 14.4]
The accompanying graph shows plots of ln k versus 1>T for two different reactions. The plots have been extrapolated to the y-intercepts. Which reaction (red or blue) has (b) the larger value for the frequency factor, A? [Section 14.5]
The following graph shows two different reaction pathways for the same overall reaction at the same temperature. Is each of the following statements true or false? (b) For both paths, the rate of the reverse reaction is slower than the rate of the forward reaction.
Consider the diagram that follows, which represents two steps in an overall reaction. The red spheres are oxygen, the blue ones nitrogen, and the green ones fluorine. (d) Write the rate law for the overall reaction if the first step is the slow, rate-determining step. [Section 14.6]