Ch.11 - Liquids and Intermolecular Forces
Chapter 11, Problem 7b

The phase diagram of a hypothetical substance is
(b) What is the physical state of the substance under the following conditions? (i) T = 150 K, P = 0.2 atm; (ii) T = 100 K, P = 0.8 atm; (iii) T = 300K, P = 1.0atm. [Section 11.6]

Verified step by step guidance
1
Step 1: Understand that a phase diagram is a graphical representation of the physical states of a substance under different temperatures and pressures. The three main regions correspond to the solid, liquid, and gas phases. The lines represent the conditions under which two phases can coexist in equilibrium.
Step 2: For each given condition, locate the point on the phase diagram that corresponds to the given temperature and pressure. This can be done by finding the temperature on the x-axis and the pressure on the y-axis, and seeing where these two values intersect on the diagram.
Step 3: Determine the phase of the substance at each point. If the point falls in the region for solid, the substance is in the solid phase. If it falls in the region for liquid, the substance is in the liquid phase. If it falls in the region for gas, the substance is in the gas phase.
Step 4: For (i) T = 150 K, P = 0.2 atm, locate this point on the phase diagram. The phase of the substance at this point is the physical state of the substance under these conditions.
Step 5: Repeat Step 4 for (ii) T = 100 K, P = 0.8 atm and (iii) T = 300K, P = 1.0atm. The phase of the substance at each of these points is the physical state of the substance under these conditions.

Verified Solution

Video duration:
1m
This video solution was recommended by our tutors as helpful for the problem above.
Was this helpful?

Key Concepts

Here are the essential concepts you must grasp in order to answer the question correctly.

Phase Diagrams

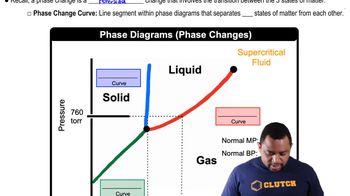
A phase diagram is a graphical representation that shows the states of a substance (solid, liquid, gas) at various temperatures and pressures. It typically includes lines that separate different phases, indicating the conditions under which a substance will change from one phase to another. Understanding how to read a phase diagram is crucial for determining the physical state of a substance under specific conditions.
Recommended video:
Guided course
03:22
Phase Changes in Diagrams

Critical Point

The critical point on a phase diagram marks the end of the phase boundary between liquid and gas. Beyond this point, the substance cannot exist as a liquid regardless of pressure. Recognizing the critical point helps in understanding the behavior of substances at high temperatures and pressures, which is essential for interpreting the given conditions in the question.
Recommended video:
Guided course
03:05
Boiling Point Elevation

Triple Point

The triple point is the unique set of conditions at which all three phases of a substance (solid, liquid, and gas) coexist in equilibrium. It is a specific point on the phase diagram and is critical for understanding the transitions between phases. Knowing the triple point allows for better predictions of the state of a substance under varying temperature and pressure conditions.
Recommended video:
Guided course
03:05
Boiling Point Elevation