Ch.11 - Liquids, Solids & Intermolecular Forces
Chapter 11, Problem 95

Based on the phase diagram of CO2 shown in Figure 11.39(b), describe the state changes that occur when the temperature of CO2 is increased from 190 K to 350 K at a constant pressure of (b) 5.1 atm, (c) 10 atm, and (d) 100 atm.

Verified step by step guidance
1
<b>Step 1:</b> Understand the phase diagram of CO2. A phase diagram shows the state of a substance (solid, liquid, gas) at various temperatures and pressures. Key points include the triple point, critical point, and the lines separating different phases.
<b>Step 2:</b> For (b) 5.1 atm: Locate 5.1 atm on the pressure axis of the phase diagram. At 190 K, CO2 is likely in the solid phase. As temperature increases, observe the path on the diagram to determine when CO2 transitions from solid to gas (sublimation) since 5.1 atm is below the triple point pressure.
<b>Step 3:</b> For (c) 10 atm: Locate 10 atm on the pressure axis. At 190 K, CO2 is in the solid phase. As temperature increases, CO2 will first transition from solid to liquid (melting) and then from liquid to gas (vaporization) as it crosses the phase boundaries.
<b>Step 4:</b> For (d) 100 atm: Locate 100 atm on the pressure axis. At 190 K, CO2 is in the solid phase. As temperature increases, CO2 will transition from solid to liquid (melting) and then from liquid to gas (vaporization) as it crosses the phase boundaries.
<b>Step 5:</b> Summarize the state changes: At 5.1 atm, CO2 sublimes from solid to gas. At 10 atm, CO2 melts from solid to liquid and then vaporizes to gas. At 100 atm, CO2 also melts from solid to liquid and then vaporizes to gas.>

Key Concepts

Here are the essential concepts you must grasp in order to answer the question correctly.

Phase Diagram

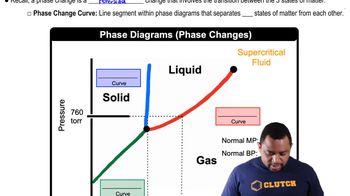
A phase diagram is a graphical representation that shows the states of a substance (solid, liquid, gas) at various temperatures and pressures. It helps visualize the conditions under which a substance exists in different phases and the transitions between these phases, such as melting, boiling, and sublimation.
Recommended video:
Guided course
03:22
Phase Changes in Diagrams

Critical Point

The critical point on a phase diagram marks the end of the liquid-gas phase boundary, beyond which the distinction between liquid and gas phases disappears. Above this temperature and pressure, the substance exists as a supercritical fluid, exhibiting properties of both liquids and gases, which is crucial for understanding behavior at high pressures.
Recommended video:
Guided course
03:05
Boiling Point Elevation

Sublimation and Deposition

Sublimation is the process where a solid transitions directly to a gas without passing through the liquid phase, while deposition is the reverse process. For CO2, these phase changes are significant at low temperatures and pressures, and understanding these processes is essential when analyzing state changes as temperature increases in the given pressure conditions.
Recommended video:
Guided course
01:19
Sublimation Phase Change Example
Related Practice